Cree GED/Equivalency

COMPARE

Cree
Race
Ancestry
AfghanAfricanAlaska NativeAlaskan AthabascanAlbanianAleutAlsatianAmericanApacheArabArapahoArgentineanArmenianAssyrian/Chaldean/SyriacAustralianAustrianBahamianBangladeshiBarbadianBasqueBelgianBelizeanBermudanBhutaneseBlackfeetBolivianBrazilianBritishBritish West IndianBulgarianBurmeseCajunCambodianCanadianCape VerdeanCarpatho RusynCelticCentral AmericanCentral American IndianCherokeeCheyenneChickasawChileanChineseChippewaChoctawColombianColvilleComancheCosta RicanCreeCreekCroatianCrowCubanCypriotCzechCzechoslovakianDanishDelawareDominicanDutchDutch West IndianEastern EuropeanEcuadorianEgyptianEnglishEstonianEthiopianEuropeanFijianFilipinoFinnishFrenchFrench American IndianFrench CanadianGermanGerman RussianGhanaianGreekGuamanian/ChamorroGuatemalanGuyaneseHaitianHmongHonduranHopiHoumaHungarianIcelanderIndian (Asian)IndonesianInupiatIranianIraqiIrishIroquoisIsraeliItalianJamaicanJapaneseJordanianKenyanKiowaKoreanLaotianLatvianLebaneseLiberianLithuanianLumbeeLuxembourgerMacedonianMalaysianMalteseMarshalleseMenomineeMexicanMexican American IndianMongolianMoroccanNative HawaiianNavajoNepaleseNew ZealanderNicaraguanNigerianNorthern EuropeanNorwegianOkinawanOsageOttawaPaiutePakistaniPalestinianPanamanianParaguayanPennsylvania GermanPeruvianPimaPolishPortuguesePotawatomiPuebloPuerto RicanPuget Sound SalishRomanianRussianSalvadoranSamoanScandinavianScotch-IrishScottishSeminoleSenegaleseSerbianShoshoneSierra LeoneanSiouxSlavicSlovakSloveneSomaliSouth AfricanSouth AmericanSouth American IndianSoviet UnionSpaniardSpanishSpanish AmericanSpanish American IndianSri LankanSubsaharan AfricanSudaneseSwedishSwissSyrianTaiwaneseThaiTlingit-HaidaTohono O'OdhamTonganTrinidadian and TobagonianTsimshianTurkishU.S. Virgin IslanderUgandanUkrainianUruguayanUteVenezuelanVietnameseWelshWest IndianYakamaYaquiYugoslavianYumanYup'ikZimbabwean
Immigration
NonimmigrantsImmigrantsAfghanistanAfricaAlbaniaArgentinaArmeniaAsiaAustraliaAustriaBahamasBangladeshBarbadosBelarusBelgiumBelizeBoliviaBosnia and HerzegovinaBrazilBulgariaBurma/MyanmarCabo VerdeCambodiaCameroonCanadaCaribbeanCentral AmericaChileChinaColombiaCongoCosta RicaCroatiaCubaCzechoslovakiaDenmarkDominicaDominican RepublicEastern AfricaEastern AsiaEastern EuropeEcuadorEgyptEl SalvadorEnglandEritreaEthiopiaEuropeFijiFranceGermanyGhanaGreeceGrenadaGuatemalaGuyanaHaitiHondurasHong KongHungaryIndiaIndonesiaIranIraqIrelandIsraelItalyJamaicaJapanJordanKazakhstanKenyaKoreaKuwaitLaosLatin AmericaLatviaLebanonLiberiaLithuaniaMalaysiaMexicoMicronesiaMiddle AfricaMoldovaMoroccoNepalNetherlandsNicaraguaNigeriaNorth AmericaNorth MacedoniaNorthern AfricaNorthern EuropeNorwayOceaniaPakistanPanamaPeruPhilippinesPolandPortugalRomaniaRussiaSaudi ArabiaScotlandSenegalSerbiaSierra LeoneSingaporeSomaliaSouth AfricaSouth AmericaSouth Central AsiaSouth Eastern AsiaSouthern EuropeSpainSri LankaSt. Vincent and the GrenadinesSudanSwedenSwitzerlandSyriaTaiwanThailandTrinidad and TobagoTurkeyUgandaUkraineUruguayUzbekistanVenezuelaVietnamWest IndiesWestern AfricaWestern AsiaWestern EuropeYemenZaireZimbabweAzores
Select to Compare
Race
Ancestry
AfghanAfricanAlaska NativeAlaskan AthabascanAlbanianAleutAlsatianAmericanApacheArabArapahoArgentineanArmenianAssyrian/Chaldean/SyriacAustralianAustrianBahamianBangladeshiBarbadianBasqueBelgianBelizeanBermudanBhutaneseBlackfeetBolivianBrazilianBritishBritish West IndianBulgarianBurmeseCajunCambodianCanadianCape VerdeanCarpatho RusynCelticCentral AmericanCentral American IndianCherokeeCheyenneChickasawChileanChineseChippewaChoctawColombianColvilleComancheCosta RicanCreekCroatianCrowCubanCypriotCzechCzechoslovakianDanishDelawareDominicanDutchDutch West IndianEastern EuropeanEcuadorianEgyptianEnglishEstonianEthiopianEuropeanFijianFilipinoFinnishFrenchFrench American IndianFrench CanadianGermanGerman RussianGhanaianGreekGuamanian/ChamorroGuatemalanGuyaneseHaitianHmongHonduranHopiHoumaHungarianIcelanderIndian (Asian)IndonesianInupiatIranianIraqiIrishIroquoisIsraeliItalianJamaicanJapaneseJordanianKenyanKiowaKoreanLaotianLatvianLebaneseLiberianLithuanianLumbeeLuxembourgerMacedonianMalaysianMalteseMarshalleseMenomineeMexicanMexican American IndianMongolianMoroccanNative HawaiianNavajoNepaleseNew ZealanderNicaraguanNigerianNorthern EuropeanNorwegianOkinawanOsageOttawaPaiutePakistaniPalestinianPanamanianParaguayanPennsylvania GermanPeruvianPimaPolishPortuguesePotawatomiPuebloPuerto RicanPuget Sound SalishRomanianRussianSalvadoranSamoanScandinavianScotch-IrishScottishSeminoleSenegaleseSerbianShoshoneSierra LeoneanSiouxSlavicSlovakSloveneSomaliSouth AfricanSouth AmericanSouth American IndianSoviet UnionSpaniardSpanishSpanish AmericanSpanish American IndianSri LankanSubsaharan AfricanSudaneseSwedishSwissSyrianTaiwaneseThaiTlingit-HaidaTohono O'OdhamTonganTrinidadian and TobagonianTsimshianTurkishU.S. Virgin IslanderUgandanUkrainianUruguayanUteVenezuelanVietnameseWelshWest IndianYakamaYaquiYugoslavianYumanYup'ikZimbabwean
Immigration
NonimmigrantsImmigrantsAfghanistanAfricaAlbaniaArgentinaArmeniaAsiaAustraliaAustriaBahamasBangladeshBarbadosBelarusBelgiumBelizeBoliviaBosnia and HerzegovinaBrazilBulgariaBurma/MyanmarCabo VerdeCambodiaCameroonCanadaCaribbeanCentral AmericaChileChinaColombiaCongoCosta RicaCroatiaCubaCzechoslovakiaDenmarkDominicaDominican RepublicEastern AfricaEastern AsiaEastern EuropeEcuadorEgyptEl SalvadorEnglandEritreaEthiopiaEuropeFijiFranceGermanyGhanaGreeceGrenadaGuatemalaGuyanaHaitiHondurasHong KongHungaryIndiaIndonesiaIranIraqIrelandIsraelItalyJamaicaJapanJordanKazakhstanKenyaKoreaKuwaitLaosLatin AmericaLatviaLebanonLiberiaLithuaniaMalaysiaMexicoMicronesiaMiddle AfricaMoldovaMoroccoNepalNetherlandsNicaraguaNigeriaNorth AmericaNorth MacedoniaNorthern AfricaNorthern EuropeNorwayOceaniaPakistanPanamaPeruPhilippinesPolandPortugalRomaniaRussiaSaudi ArabiaScotlandSenegalSerbiaSierra LeoneSingaporeSomaliaSouth AfricaSouth AmericaSouth Central AsiaSouth Eastern AsiaSouthern EuropeSpainSri LankaSt. Vincent and the GrenadinesSudanSwedenSwitzerlandSyriaTaiwanThailandTrinidad and TobagoTurkeyUgandaUkraineUruguayUzbekistanVenezuelaVietnamWest IndiesWestern AfricaWestern AsiaWestern EuropeYemenZaireZimbabweAzores
GED/Equivalency
Income
Poverty
Unemployment
Labor Participation
Family Structure
Vehicle Availability
Education Level
Disability

Cree GED/Equivalency
Poor

85.0%
GED/EQUIVALENCY
15.9/ 100
METRIC RATING
202nd/ 347
METRIC RANK

Cree GED/Equivalency Correlation Chart

The statistical analysis conducted on geographies consisting of 76,211,744 people shows a substantial negative correlation between the proportion of Cree and percentage of population with at least ged/equivalency education in the United States with a correlation coefficient (R) of -0.545 and weighted average of 85.0%. On average, for every 1% (one percent) increase in Cree within a typical geography, there is a decrease of 0.82% in percentage of population with at least ged/equivalency education.
Cree GED/Equivalency
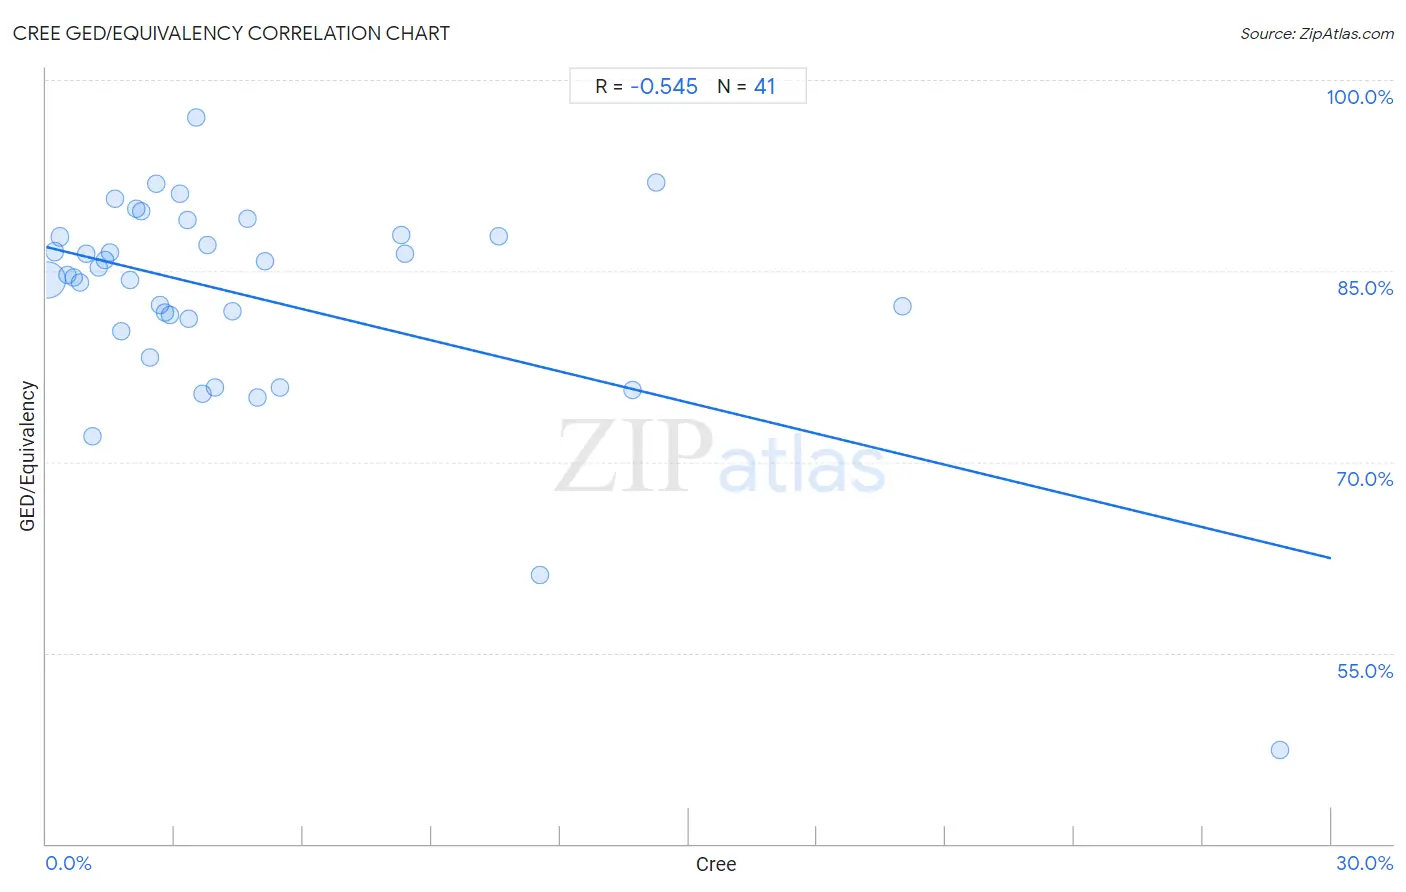
It is essential to understand that the correlation between the percentage of Cree and percentage of population with at least ged/equivalency education does not imply a direct cause-and-effect relationship. It remains uncertain whether the presence of Cree influences an upward or downward trend in the level of percentage of population with at least ged/equivalency education within an area, or if Cree simply ended up residing in those areas with higher or lower levels of percentage of population with at least ged/equivalency education due to other factors.

Demographics Similar to Cree by GED/Equivalency

In terms of ged/equivalency, the demographic groups most similar to Cree are Portuguese (85.0%, a difference of 0.0%), Uruguayan (85.0%, a difference of 0.010%), Somali (85.0%, a difference of 0.020%), Panamanian (85.0%, a difference of 0.020%), and Hawaiian (85.0%, a difference of 0.030%).
DemographicsRating | RankGED/Equivalency
Chippewa
20.8
/100
|
#195
Fair
85.2%
Tongans
20.7
/100
|
#196
Fair
85.2%
Costa Ricans
20.4
/100
|
#197
Fair
85.2%
Immigrants from Africa
17.5
/100
|
#198
Poor
85.1%
Somalis
16.4
/100
|
#199
Poor
85.0%
Uruguayans
16.0
/100
|
#200
Poor
85.0%
Portuguese
15.9
/100
|
#201
Poor
85.0%
Cree
15.9
/100
|
#202
Poor
85.0%
Panamanians
15.3
/100
|
#203
Poor
85.0%
Hawaiians
15.2
/100
|
#204
Poor
85.0%
Liberians
14.6
/100
|
#205
Poor
85.0%
Samoans
13.7
/100
|
#206
Poor
84.9%
Hmong
13.1
/100
|
#207
Poor
84.9%
Marshallese
12.5
/100
|
#208
Poor
84.9%
Colombians
12.3
/100
|
#209
Poor
84.9%

Cree GED/Equivalency Correlation Summary

MeasurementCree DataGED/Equivalency Data
Minimum0.016%47.4%
Maximum28.8%97.0%
Range28.8%49.7%
Mean4.8%83.0%
Median2.9%84.7%
Interquartile 25% (IQ1)1.4%80.8%
Interquartile 75% (IQ3)5.0%87.8%
Interquartile Range (IQR)3.6%7.0%
Standard Deviation (Sample)5.8%8.7%
Standard Deviation (Population)5.7%8.5%

Correlation Details

Cree PercentileSample SizeGED/Equivalency
[
0.0%
-
0.5%
]
0.016%
72,697,89384.3%
[
0.0%
-
0.5%
]
0.19%
2,206,46486.5%
[
0.0%
-
0.5%
]
0.33%
618,03787.7%
[
0.0%
-
0.5%
]
0.49%
319,75284.7%
[
0.5%
-
1.0%
]
0.65%
86,12184.5%
[
0.5%
-
1.0%
]
0.77%
92,17284.1%
[
0.5%
-
1.0%
]
0.93%
36,30486.4%
[
1.0%
-
1.5%
]
1.08%
7,34572.1%
[
1.0%
-
1.5%
]
1.21%
19,69985.2%
[
1.0%
-
1.5%
]
1.36%
22,91085.9%
[
1.0%
-
1.5%
]
1.49%
14,93086.4%
[
1.5%
-
2.0%
]
1.60%
33,78090.7%
[
1.5%
-
2.0%
]
1.75%
4,74180.3%
[
1.5%
-
2.0%
]
1.95%
9,71184.3%
[
2.0%
-
2.5%
]
2.10%
1,52489.9%
[
2.0%
-
2.5%
]
2.23%
3,49489.7%
[
2.0%
-
2.5%
]
2.42%
3,22578.2%
[
2.5%
-
3.0%
]
2.56%
23491.8%
[
2.5%
-
3.0%
]
2.67%
6,14682.3%
[
2.5%
-
3.0%
]
2.76%
1,01581.7%
[
2.5%
-
3.0%
]
2.89%
69381.5%
[
3.0%
-
3.5%
]
3.13%
4,11891.0%
[
3.0%
-
3.5%
]
3.30%
3,81389.0%
[
3.0%
-
3.5%
]
3.34%
59981.3%
[
3.5%
-
4.0%
]
3.51%
1,82597.0%
[
3.5%
-
4.0%
]
3.64%
1,40375.3%
[
3.5%
-
4.0%
]
3.77%
21287.1%
[
3.5%
-
4.0%
]
3.93%
78975.8%
[
4.0%
-
4.5%
]
4.35%
68981.8%
[
4.5%
-
5.0%
]
4.69%
46989.1%
[
4.5%
-
5.0%
]
4.93%
69075.1%
[
5.0%
-
5.5%
]
5.10%
2,62985.8%
[
5.0%
-
5.5%
]
5.46%
3,66275.8%
[
8.0%
-
8.5%
]
8.30%
26587.8%
[
8.0%
-
8.5%
]
8.38%
1,59986.3%
[
10.5%
-
11.0%
]
10.57%
57787.7%
[
11.5%
-
12.0%
]
11.53%
93761.1%
[
13.5%
-
14.0%
]
13.70%
38775.7%
[
14.0%
-
14.5%
]
14.25%
77292.0%
[
20.0%
-
20.5%
]
20.00%
6082.2%
[
28.5%
-
29.0%
]
28.81%
5947.4%