Cree Female Poverty Among 25-34 Year Olds

COMPARE

Cree
Race
Ancestry
AfghanAfricanAlaska NativeAlaskan AthabascanAlbanianAleutAlsatianAmericanApacheArabArapahoArgentineanArmenianAssyrian/Chaldean/SyriacAustralianAustrianBahamianBangladeshiBarbadianBasqueBelgianBelizeanBermudanBhutaneseBlackfeetBolivianBrazilianBritishBritish West IndianBulgarianBurmeseCajunCambodianCanadianCape VerdeanCarpatho RusynCelticCentral AmericanCentral American IndianCherokeeCheyenneChickasawChileanChineseChippewaChoctawColombianColvilleComancheCosta RicanCreeCreekCroatianCrowCubanCypriotCzechCzechoslovakianDanishDelawareDominicanDutchDutch West IndianEastern EuropeanEcuadorianEgyptianEnglishEstonianEthiopianEuropeanFijianFilipinoFinnishFrenchFrench American IndianFrench CanadianGermanGerman RussianGhanaianGreekGuamanian/ChamorroGuatemalanGuyaneseHaitianHmongHonduranHopiHoumaHungarianIcelanderIndian (Asian)IndonesianInupiatIranianIraqiIrishIroquoisIsraeliItalianJamaicanJapaneseJordanianKenyanKiowaKoreanLaotianLatvianLebaneseLiberianLithuanianLumbeeLuxembourgerMacedonianMalaysianMalteseMarshalleseMenomineeMexicanMexican American IndianMongolianMoroccanNative HawaiianNavajoNepaleseNew ZealanderNicaraguanNigerianNorthern EuropeanNorwegianOkinawanOsageOttawaPaiutePakistaniPalestinianPanamanianParaguayanPennsylvania GermanPeruvianPimaPolishPortuguesePotawatomiPuebloPuerto RicanPuget Sound SalishRomanianRussianSalvadoranSamoanScandinavianScotch-IrishScottishSeminoleSenegaleseSerbianShoshoneSierra LeoneanSiouxSlavicSlovakSloveneSomaliSouth AfricanSouth AmericanSouth American IndianSoviet UnionSpaniardSpanishSpanish AmericanSpanish American IndianSri LankanSubsaharan AfricanSudaneseSwedishSwissSyrianTaiwaneseThaiTlingit-HaidaTohono O'OdhamTonganTrinidadian and TobagonianTsimshianTurkishU.S. Virgin IslanderUgandanUkrainianUruguayanUteVenezuelanVietnameseWelshWest IndianYakamaYaquiYugoslavianYumanYup'ikZimbabwean
Immigration
NonimmigrantsImmigrantsAfghanistanAfricaAlbaniaArgentinaArmeniaAsiaAustraliaAustriaBahamasBangladeshBarbadosBelarusBelgiumBelizeBoliviaBosnia and HerzegovinaBrazilBulgariaBurma/MyanmarCabo VerdeCambodiaCameroonCanadaCaribbeanCentral AmericaChileChinaColombiaCongoCosta RicaCroatiaCubaCzechoslovakiaDenmarkDominicaDominican RepublicEastern AfricaEastern AsiaEastern EuropeEcuadorEgyptEl SalvadorEnglandEritreaEthiopiaEuropeFijiFranceGermanyGhanaGreeceGrenadaGuatemalaGuyanaHaitiHondurasHong KongHungaryIndiaIndonesiaIranIraqIrelandIsraelItalyJamaicaJapanJordanKazakhstanKenyaKoreaKuwaitLaosLatin AmericaLatviaLebanonLiberiaLithuaniaMalaysiaMexicoMicronesiaMiddle AfricaMoldovaMoroccoNepalNetherlandsNicaraguaNigeriaNorth AmericaNorth MacedoniaNorthern AfricaNorthern EuropeNorwayOceaniaPakistanPanamaPeruPhilippinesPolandPortugalRomaniaRussiaSaudi ArabiaScotlandSenegalSerbiaSierra LeoneSingaporeSomaliaSouth AfricaSouth AmericaSouth Central AsiaSouth Eastern AsiaSouthern EuropeSpainSri LankaSt. Vincent and the GrenadinesSudanSwedenSwitzerlandSyriaTaiwanThailandTrinidad and TobagoTurkeyUgandaUkraineUruguayUzbekistanVenezuelaVietnamWest IndiesWestern AfricaWestern AsiaWestern EuropeYemenZaireZimbabweAzores
Select to Compare
Race
Ancestry
AfghanAfricanAlaska NativeAlaskan AthabascanAlbanianAleutAlsatianAmericanApacheArabArapahoArgentineanArmenianAssyrian/Chaldean/SyriacAustralianAustrianBahamianBangladeshiBarbadianBasqueBelgianBelizeanBermudanBhutaneseBlackfeetBolivianBrazilianBritishBritish West IndianBulgarianBurmeseCajunCambodianCanadianCape VerdeanCarpatho RusynCelticCentral AmericanCentral American IndianCherokeeCheyenneChickasawChileanChineseChippewaChoctawColombianColvilleComancheCosta RicanCreekCroatianCrowCubanCypriotCzechCzechoslovakianDanishDelawareDominicanDutchDutch West IndianEastern EuropeanEcuadorianEgyptianEnglishEstonianEthiopianEuropeanFijianFilipinoFinnishFrenchFrench American IndianFrench CanadianGermanGerman RussianGhanaianGreekGuamanian/ChamorroGuatemalanGuyaneseHaitianHmongHonduranHopiHoumaHungarianIcelanderIndian (Asian)IndonesianInupiatIranianIraqiIrishIroquoisIsraeliItalianJamaicanJapaneseJordanianKenyanKiowaKoreanLaotianLatvianLebaneseLiberianLithuanianLumbeeLuxembourgerMacedonianMalaysianMalteseMarshalleseMenomineeMexicanMexican American IndianMongolianMoroccanNative HawaiianNavajoNepaleseNew ZealanderNicaraguanNigerianNorthern EuropeanNorwegianOkinawanOsageOttawaPaiutePakistaniPalestinianPanamanianParaguayanPennsylvania GermanPeruvianPimaPolishPortuguesePotawatomiPuebloPuerto RicanPuget Sound SalishRomanianRussianSalvadoranSamoanScandinavianScotch-IrishScottishSeminoleSenegaleseSerbianShoshoneSierra LeoneanSiouxSlavicSlovakSloveneSomaliSouth AfricanSouth AmericanSouth American IndianSoviet UnionSpaniardSpanishSpanish AmericanSpanish American IndianSri LankanSubsaharan AfricanSudaneseSwedishSwissSyrianTaiwaneseThaiTlingit-HaidaTohono O'OdhamTonganTrinidadian and TobagonianTsimshianTurkishU.S. Virgin IslanderUgandanUkrainianUruguayanUteVenezuelanVietnameseWelshWest IndianYakamaYaquiYugoslavianYumanYup'ikZimbabwean
Immigration
NonimmigrantsImmigrantsAfghanistanAfricaAlbaniaArgentinaArmeniaAsiaAustraliaAustriaBahamasBangladeshBarbadosBelarusBelgiumBelizeBoliviaBosnia and HerzegovinaBrazilBulgariaBurma/MyanmarCabo VerdeCambodiaCameroonCanadaCaribbeanCentral AmericaChileChinaColombiaCongoCosta RicaCroatiaCubaCzechoslovakiaDenmarkDominicaDominican RepublicEastern AfricaEastern AsiaEastern EuropeEcuadorEgyptEl SalvadorEnglandEritreaEthiopiaEuropeFijiFranceGermanyGhanaGreeceGrenadaGuatemalaGuyanaHaitiHondurasHong KongHungaryIndiaIndonesiaIranIraqIrelandIsraelItalyJamaicaJapanJordanKazakhstanKenyaKoreaKuwaitLaosLatin AmericaLatviaLebanonLiberiaLithuaniaMalaysiaMexicoMicronesiaMiddle AfricaMoldovaMoroccoNepalNetherlandsNicaraguaNigeriaNorth AmericaNorth MacedoniaNorthern AfricaNorthern EuropeNorwayOceaniaPakistanPanamaPeruPhilippinesPolandPortugalRomaniaRussiaSaudi ArabiaScotlandSenegalSerbiaSierra LeoneSingaporeSomaliaSouth AfricaSouth AmericaSouth Central AsiaSouth Eastern AsiaSouthern EuropeSpainSri LankaSt. Vincent and the GrenadinesSudanSwedenSwitzerlandSyriaTaiwanThailandTrinidad and TobagoTurkeyUgandaUkraineUruguayUzbekistanVenezuelaVietnamWest IndiesWestern AfricaWestern AsiaWestern EuropeYemenZaireZimbabweAzores
Female Poverty Among 25-34 Year Olds
Income
Poverty
Unemployment
Labor Participation
Family Structure
Vehicle Availability
Education Level
Disability

Cree Female Poverty Among 25-34 Year Olds
Tragic

15.6%
POVERTY | FEMALES 25-34
0.1/ 100
METRIC RATING
271st/ 347
METRIC RANK

Cree Female Poverty Among 25-34 Year Olds Correlation Chart

The statistical analysis conducted on geographies consisting of 75,962,036 people shows a mild positive correlation between the proportion of Cree and poverty level among females between the ages 25 and 34 in the United States with a correlation coefficient (R) of 0.382 and weighted average of 15.6%. On average, for every 1% (one percent) increase in Cree within a typical geography, there is an increase of 1.5% in poverty level among females between the ages 25 and 34.
Cree Female Poverty Among 25-34 Year Olds
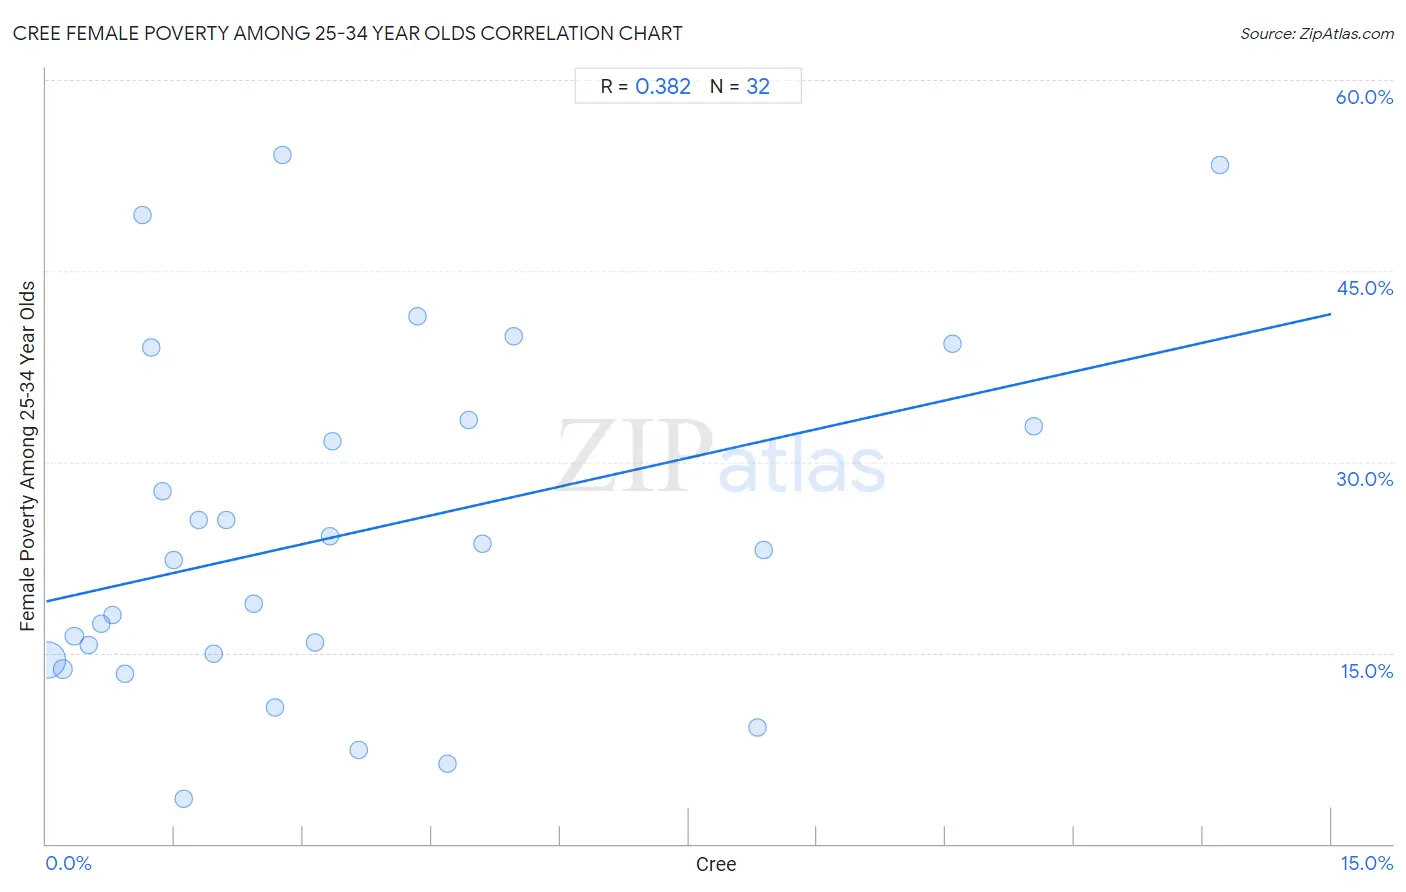
It is essential to understand that the correlation between the percentage of Cree and poverty level among females between the ages 25 and 34 does not imply a direct cause-and-effect relationship. It remains uncertain whether the presence of Cree influences an upward or downward trend in the level of poverty level among females between the ages 25 and 34 within an area, or if Cree simply ended up residing in those areas with higher or lower levels of poverty level among females between the ages 25 and 34 due to other factors.

Demographics Similar to Cree by Female Poverty Among 25-34 Year Olds

In terms of female poverty among 25-34 year olds, the demographic groups most similar to Cree are British West Indian (15.6%, a difference of 0.010%), Senegalese (15.6%, a difference of 0.060%), Subsaharan African (15.6%, a difference of 0.16%), Nonimmigrants (15.6%, a difference of 0.17%), and Immigrants from Senegal (15.6%, a difference of 0.37%).
DemographicsRating | RankFemale Poverty Among 25-34 Year Olds
Pennsylvania Germans
0.1
/100
|
#264
Tragic
15.4%
Immigrants from Liberia
0.1
/100
|
#265
Tragic
15.4%
Immigrants from Somalia
0.1
/100
|
#266
Tragic
15.4%
Central Americans
0.1
/100
|
#267
Tragic
15.5%
Immigrants from Senegal
0.1
/100
|
#268
Tragic
15.6%
Sub-Saharan Africans
0.1
/100
|
#269
Tragic
15.6%
British West Indians
0.1
/100
|
#270
Tragic
15.6%
Cree
0.1
/100
|
#271
Tragic
15.6%
Senegalese
0.1
/100
|
#272
Tragic
15.6%
Nonimmigrants
0.1
/100
|
#273
Tragic
15.6%
Immigrants from Caribbean
0.0
/100
|
#274
Tragic
15.7%
Immigrants from the Azores
0.0
/100
|
#275
Tragic
15.8%
Immigrants from Zaire
0.0
/100
|
#276
Tragic
15.8%
Immigrants from Micronesia
0.0
/100
|
#277
Tragic
15.8%
French American Indians
0.0
/100
|
#278
Tragic
15.9%

Cree Female Poverty Among 25-34 Year Olds Correlation Summary

MeasurementCree DataFemale Poverty Among 25-34 Year Olds Data
Minimum0.016%3.5%
Maximum13.7%54.1%
Range13.7%50.6%
Mean3.6%24.4%
Median2.5%22.7%
Interquartile 25% (IQ1)1.2%14.7%
Interquartile 75% (IQ3)4.8%33.1%
Interquartile Range (IQR)3.6%18.4%
Standard Deviation (Sample)3.5%13.7%
Standard Deviation (Population)3.4%13.4%

Correlation Details

Cree PercentileSample SizeFemale Poverty Among 25-34 Year Olds
[
0.0%
-
0.5%
]
0.016%
72,623,02614.5%
[
0.0%
-
0.5%
]
0.19%
2,122,50213.7%
[
0.0%
-
0.5%
]
0.33%
593,87416.3%
[
0.0%
-
0.5%
]
0.49%
315,03615.6%
[
0.5%
-
1.0%
]
0.65%
67,61817.3%
[
0.5%
-
1.0%
]
0.77%
89,20118.0%
[
0.5%
-
1.0%
]
0.92%
32,79813.3%
[
1.0%
-
1.5%
]
1.13%
79649.4%
[
1.0%
-
1.5%
]
1.22%
14,85339.0%
[
1.0%
-
1.5%
]
1.36%
16,57727.7%
[
1.0%
-
1.5%
]
1.49%
14,31622.2%
[
1.5%
-
2.0%
]
1.60%
29,9613.5%
[
1.5%
-
2.0%
]
1.78%
1,68325.4%
[
1.5%
-
2.0%
]
1.96%
7,70815.0%
[
2.0%
-
2.5%
]
2.10%
1,18925.5%
[
2.0%
-
2.5%
]
2.42%
3,22518.9%
[
2.5%
-
3.0%
]
2.67%
6,14610.7%
[
2.5%
-
3.0%
]
2.76%
87154.1%
[
3.0%
-
3.5%
]
3.14%
3,50815.8%
[
3.0%
-
3.5%
]
3.31%
3,59924.1%
[
3.0%
-
3.5%
]
3.34%
59931.6%
[
3.5%
-
4.0%
]
3.64%
1,1817.3%
[
4.0%
-
4.5%
]
4.33%
55441.5%
[
4.5%
-
5.0%
]
4.69%
4696.2%
[
4.5%
-
5.0%
]
4.93%
69033.3%
[
5.0%
-
5.5%
]
5.10%
2,62923.6%
[
5.0%
-
5.5%
]
5.46%
3,66239.9%
[
8.0%
-
8.5%
]
8.30%
2659.1%
[
8.0%
-
8.5%
]
8.38%
1,59923.1%
[
10.5%
-
11.0%
]
10.57%
57739.3%
[
11.5%
-
12.0%
]
11.53%
93732.8%
[
13.5%
-
14.0%
]
13.70%
38753.3%