Cree Married-Couple Family Poverty

COMPARE

Cree
Race
Ancestry
AfghanAfricanAlaska NativeAlaskan AthabascanAlbanianAleutAlsatianAmericanApacheArabArapahoArgentineanArmenianAssyrian/Chaldean/SyriacAustralianAustrianBahamianBangladeshiBarbadianBasqueBelgianBelizeanBermudanBhutaneseBlackfeetBolivianBrazilianBritishBritish West IndianBulgarianBurmeseCajunCambodianCanadianCape VerdeanCarpatho RusynCelticCentral AmericanCentral American IndianCherokeeCheyenneChickasawChileanChineseChippewaChoctawColombianColvilleComancheCosta RicanCreeCreekCroatianCrowCubanCypriotCzechCzechoslovakianDanishDelawareDominicanDutchDutch West IndianEastern EuropeanEcuadorianEgyptianEnglishEstonianEthiopianEuropeanFijianFilipinoFinnishFrenchFrench American IndianFrench CanadianGermanGerman RussianGhanaianGreekGuamanian/ChamorroGuatemalanGuyaneseHaitianHmongHonduranHopiHoumaHungarianIcelanderIndian (Asian)IndonesianInupiatIranianIraqiIrishIroquoisIsraeliItalianJamaicanJapaneseJordanianKenyanKiowaKoreanLaotianLatvianLebaneseLiberianLithuanianLumbeeLuxembourgerMacedonianMalaysianMalteseMarshalleseMenomineeMexicanMexican American IndianMongolianMoroccanNative HawaiianNavajoNepaleseNew ZealanderNicaraguanNigerianNorthern EuropeanNorwegianOkinawanOsageOttawaPaiutePakistaniPalestinianPanamanianParaguayanPennsylvania GermanPeruvianPimaPolishPortuguesePotawatomiPuebloPuerto RicanPuget Sound SalishRomanianRussianSalvadoranSamoanScandinavianScotch-IrishScottishSeminoleSenegaleseSerbianShoshoneSierra LeoneanSiouxSlavicSlovakSloveneSomaliSouth AfricanSouth AmericanSouth American IndianSoviet UnionSpaniardSpanishSpanish AmericanSpanish American IndianSri LankanSubsaharan AfricanSudaneseSwedishSwissSyrianTaiwaneseThaiTlingit-HaidaTohono O'OdhamTonganTrinidadian and TobagonianTsimshianTurkishU.S. Virgin IslanderUgandanUkrainianUruguayanUteVenezuelanVietnameseWelshWest IndianYakamaYaquiYugoslavianYumanYup'ikZimbabwean
Immigration
NonimmigrantsImmigrantsAfghanistanAfricaAlbaniaArgentinaArmeniaAsiaAustraliaAustriaBahamasBangladeshBarbadosBelarusBelgiumBelizeBoliviaBosnia and HerzegovinaBrazilBulgariaBurma/MyanmarCabo VerdeCambodiaCameroonCanadaCaribbeanCentral AmericaChileChinaColombiaCongoCosta RicaCroatiaCubaCzechoslovakiaDenmarkDominicaDominican RepublicEastern AfricaEastern AsiaEastern EuropeEcuadorEgyptEl SalvadorEnglandEritreaEthiopiaEuropeFijiFranceGermanyGhanaGreeceGrenadaGuatemalaGuyanaHaitiHondurasHong KongHungaryIndiaIndonesiaIranIraqIrelandIsraelItalyJamaicaJapanJordanKazakhstanKenyaKoreaKuwaitLaosLatin AmericaLatviaLebanonLiberiaLithuaniaMalaysiaMexicoMicronesiaMiddle AfricaMoldovaMoroccoNepalNetherlandsNicaraguaNigeriaNorth AmericaNorth MacedoniaNorthern AfricaNorthern EuropeNorwayOceaniaPakistanPanamaPeruPhilippinesPolandPortugalRomaniaRussiaSaudi ArabiaScotlandSenegalSerbiaSierra LeoneSingaporeSomaliaSouth AfricaSouth AmericaSouth Central AsiaSouth Eastern AsiaSouthern EuropeSpainSri LankaSt. Vincent and the GrenadinesSudanSwedenSwitzerlandSyriaTaiwanThailandTrinidad and TobagoTurkeyUgandaUkraineUruguayUzbekistanVenezuelaVietnamWest IndiesWestern AfricaWestern AsiaWestern EuropeYemenZaireZimbabweAzores
Select to Compare
Race
Ancestry
AfghanAfricanAlaska NativeAlaskan AthabascanAlbanianAleutAlsatianAmericanApacheArabArapahoArgentineanArmenianAssyrian/Chaldean/SyriacAustralianAustrianBahamianBangladeshiBarbadianBasqueBelgianBelizeanBermudanBhutaneseBlackfeetBolivianBrazilianBritishBritish West IndianBulgarianBurmeseCajunCambodianCanadianCape VerdeanCarpatho RusynCelticCentral AmericanCentral American IndianCherokeeCheyenneChickasawChileanChineseChippewaChoctawColombianColvilleComancheCosta RicanCreekCroatianCrowCubanCypriotCzechCzechoslovakianDanishDelawareDominicanDutchDutch West IndianEastern EuropeanEcuadorianEgyptianEnglishEstonianEthiopianEuropeanFijianFilipinoFinnishFrenchFrench American IndianFrench CanadianGermanGerman RussianGhanaianGreekGuamanian/ChamorroGuatemalanGuyaneseHaitianHmongHonduranHopiHoumaHungarianIcelanderIndian (Asian)IndonesianInupiatIranianIraqiIrishIroquoisIsraeliItalianJamaicanJapaneseJordanianKenyanKiowaKoreanLaotianLatvianLebaneseLiberianLithuanianLumbeeLuxembourgerMacedonianMalaysianMalteseMarshalleseMenomineeMexicanMexican American IndianMongolianMoroccanNative HawaiianNavajoNepaleseNew ZealanderNicaraguanNigerianNorthern EuropeanNorwegianOkinawanOsageOttawaPaiutePakistaniPalestinianPanamanianParaguayanPennsylvania GermanPeruvianPimaPolishPortuguesePotawatomiPuebloPuerto RicanPuget Sound SalishRomanianRussianSalvadoranSamoanScandinavianScotch-IrishScottishSeminoleSenegaleseSerbianShoshoneSierra LeoneanSiouxSlavicSlovakSloveneSomaliSouth AfricanSouth AmericanSouth American IndianSoviet UnionSpaniardSpanishSpanish AmericanSpanish American IndianSri LankanSubsaharan AfricanSudaneseSwedishSwissSyrianTaiwaneseThaiTlingit-HaidaTohono O'OdhamTonganTrinidadian and TobagonianTsimshianTurkishU.S. Virgin IslanderUgandanUkrainianUruguayanUteVenezuelanVietnameseWelshWest IndianYakamaYaquiYugoslavianYumanYup'ikZimbabwean
Immigration
NonimmigrantsImmigrantsAfghanistanAfricaAlbaniaArgentinaArmeniaAsiaAustraliaAustriaBahamasBangladeshBarbadosBelarusBelgiumBelizeBoliviaBosnia and HerzegovinaBrazilBulgariaBurma/MyanmarCabo VerdeCambodiaCameroonCanadaCaribbeanCentral AmericaChileChinaColombiaCongoCosta RicaCroatiaCubaCzechoslovakiaDenmarkDominicaDominican RepublicEastern AfricaEastern AsiaEastern EuropeEcuadorEgyptEl SalvadorEnglandEritreaEthiopiaEuropeFijiFranceGermanyGhanaGreeceGrenadaGuatemalaGuyanaHaitiHondurasHong KongHungaryIndiaIndonesiaIranIraqIrelandIsraelItalyJamaicaJapanJordanKazakhstanKenyaKoreaKuwaitLaosLatin AmericaLatviaLebanonLiberiaLithuaniaMalaysiaMexicoMicronesiaMiddle AfricaMoldovaMoroccoNepalNetherlandsNicaraguaNigeriaNorth AmericaNorth MacedoniaNorthern AfricaNorthern EuropeNorwayOceaniaPakistanPanamaPeruPhilippinesPolandPortugalRomaniaRussiaSaudi ArabiaScotlandSenegalSerbiaSierra LeoneSingaporeSomaliaSouth AfricaSouth AmericaSouth Central AsiaSouth Eastern AsiaSouthern EuropeSpainSri LankaSt. Vincent and the GrenadinesSudanSwedenSwitzerlandSyriaTaiwanThailandTrinidad and TobagoTurkeyUgandaUkraineUruguayUzbekistanVenezuelaVietnamWest IndiesWestern AfricaWestern AsiaWestern EuropeYemenZaireZimbabweAzores
Married-Couple Family Poverty
Income
Poverty
Unemployment
Labor Participation
Family Structure
Vehicle Availability
Education Level
Disability

Cree Married-Couple Family Poverty
Tragic

5.9%
POVERTY | MARRIED-COUPLE FAMILIES
1.2/ 100
METRIC RATING
248th/ 347
METRIC RANK

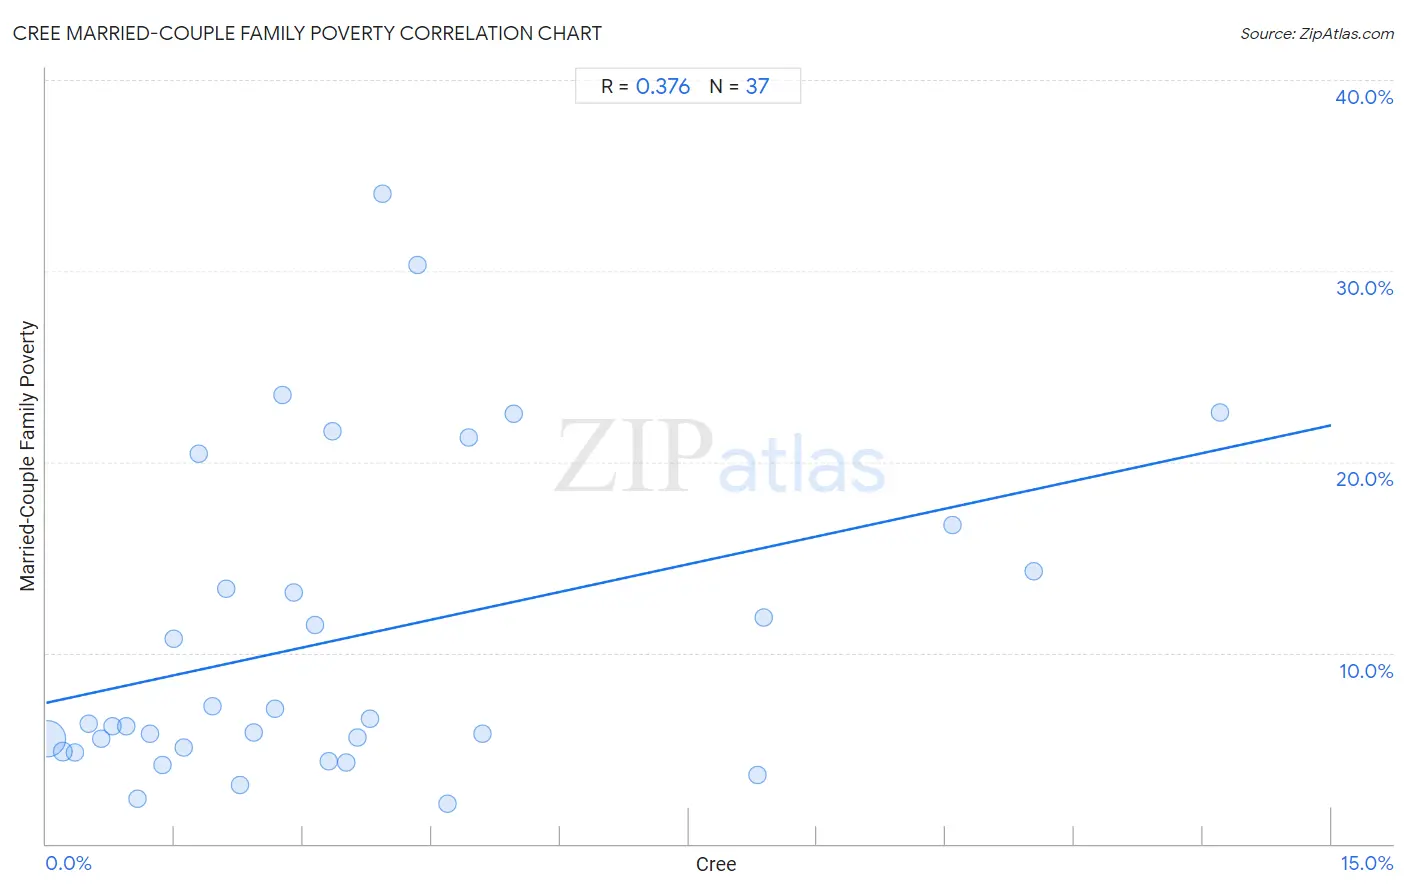
Cree Married-Couple Family Poverty Correlation Chart

The statistical analysis conducted on geographies consisting of 76,066,052 people shows a mild positive correlation between the proportion of Cree and poverty level among married-couple families in the United States with a correlation coefficient (R) of 0.376 and weighted average of 5.9%. On average, for every 1% (one percent) increase in Cree within a typical geography, there is an increase of 0.97% in poverty level among married-couple families.
Cree Married-Couple Family Poverty
It is essential to understand that the correlation between the percentage of Cree and poverty level among married-couple families does not imply a direct cause-and-effect relationship. It remains uncertain whether the presence of Cree influences an upward or downward trend in the level of poverty level among married-couple families within an area, or if Cree simply ended up residing in those areas with higher or lower levels of poverty level among married-couple families due to other factors.

Demographics Similar to Cree by Married-Couple Family Poverty

In terms of married-couple family poverty, the demographic groups most similar to Cree are Tsimshian (5.9%, a difference of 0.10%), Immigrants from Eritrea (5.9%, a difference of 0.31%), Iraqi (5.9%, a difference of 0.42%), Immigrants from Ghana (5.9%, a difference of 0.57%), and Immigrants from Venezuela (5.8%, a difference of 1.0%).
DemographicsRating | RankMarried-Couple Family Poverty
Immigrants from Panama
2.5
/100
|
#241
Tragic
5.8%
Immigrants from Western Africa
2.4
/100
|
#242
Tragic
5.8%
Somalis
2.3
/100
|
#243
Tragic
5.8%
Chickasaw
2.3
/100
|
#244
Tragic
5.8%
Immigrants from Afghanistan
2.1
/100
|
#245
Tragic
5.8%
Immigrants from Venezuela
1.8
/100
|
#246
Tragic
5.8%
Iraqis
1.4
/100
|
#247
Tragic
5.9%
Cree
1.2
/100
|
#248
Tragic
5.9%
Tsimshian
1.1
/100
|
#249
Tragic
5.9%
Immigrants from Eritrea
1.1
/100
|
#250
Tragic
5.9%
Immigrants from Ghana
1.0
/100
|
#251
Tragic
5.9%
Immigrants from Western Asia
0.7
/100
|
#252
Tragic
6.0%
Africans
0.7
/100
|
#253
Tragic
6.0%
Immigrants from Somalia
0.7
/100
|
#254
Tragic
6.0%
Comanche
0.7
/100
|
#255
Tragic
6.0%

Cree Married-Couple Family Poverty Correlation Summary

MeasurementCree DataMarried-Couple Family Poverty Data
Minimum0.016%2.1%
Maximum13.7%34.0%
Range13.7%31.9%
Mean3.5%10.8%
Median2.8%6.3%
Interquartile 25% (IQ1)1.3%4.9%
Interquartile 75% (IQ3)4.5%15.5%
Interquartile Range (IQR)3.2%10.5%
Standard Deviation (Sample)3.2%8.3%
Standard Deviation (Population)3.2%8.2%

Correlation Details

Cree PercentileSample SizeMarried-Couple Family Poverty
[
0.0%
-
0.5%
]
0.016%
72,663,0875.5%
[
0.0%
-
0.5%
]
0.19%
2,158,2604.8%
[
0.0%
-
0.5%
]
0.33%
601,0484.8%
[
0.0%
-
0.5%
]
0.49%
316,5006.3%
[
0.5%
-
1.0%
]
0.65%
71,0735.5%
[
0.5%
-
1.0%
]
0.77%
87,2526.1%
[
0.5%
-
1.0%
]
0.93%
35,1236.1%
[
1.0%
-
1.5%
]
1.07%
4,4782.3%
[
1.0%
-
1.5%
]
1.22%
17,5195.8%
[
1.0%
-
1.5%
]
1.36%
19,2514.1%
[
1.0%
-
1.5%
]
1.49%
14,19810.7%
[
1.5%
-
2.0%
]
1.60%
30,4495.1%
[
1.5%
-
2.0%
]
1.78%
1,68320.4%
[
1.5%
-
2.0%
]
1.95%
9,7117.2%
[
2.0%
-
2.5%
]
2.10%
1,52413.4%
[
2.0%
-
2.5%
]
2.26%
1,9903.1%
[
2.0%
-
2.5%
]
2.42%
3,2255.9%
[
2.5%
-
3.0%
]
2.67%
6,1467.1%
[
2.5%
-
3.0%
]
2.76%
87123.5%
[
2.5%
-
3.0%
]
2.89%
69313.2%
[
3.0%
-
3.5%
]
3.14%
3,50811.4%
[
3.0%
-
3.5%
]
3.30%
2,0614.3%
[
3.0%
-
3.5%
]
3.34%
59921.6%
[
3.0%
-
3.5%
]
3.50%
1,6304.3%
[
3.5%
-
4.0%
]
3.64%
1,4035.5%
[
3.5%
-
4.0%
]
3.77%
2126.6%
[
3.5%
-
4.0%
]
3.93%
78934.0%
[
4.0%
-
4.5%
]
4.33%
55430.3%
[
4.5%
-
5.0%
]
4.69%
4692.1%
[
4.5%
-
5.0%
]
4.93%
69021.3%
[
5.0%
-
5.5%
]
5.10%
2,6295.8%
[
5.0%
-
5.5%
]
5.46%
3,66222.5%
[
8.0%
-
8.5%
]
8.30%
2653.6%
[
8.0%
-
8.5%
]
8.38%
1,59911.9%
[
10.5%
-
11.0%
]
10.57%
57716.7%
[
11.5%
-
12.0%
]
11.53%
93714.3%
[
13.5%
-
14.0%
]
13.70%
38722.6%