Cree Self-Care Disability

COMPARE

Cree
Race
Ancestry
AfghanAfricanAlaska NativeAlaskan AthabascanAlbanianAleutAlsatianAmericanApacheArabArapahoArgentineanArmenianAssyrian/Chaldean/SyriacAustralianAustrianBahamianBangladeshiBarbadianBasqueBelgianBelizeanBermudanBhutaneseBlackfeetBolivianBrazilianBritishBritish West IndianBulgarianBurmeseCajunCambodianCanadianCape VerdeanCarpatho RusynCelticCentral AmericanCentral American IndianCherokeeCheyenneChickasawChileanChineseChippewaChoctawColombianColvilleComancheCosta RicanCreeCreekCroatianCrowCubanCypriotCzechCzechoslovakianDanishDelawareDominicanDutchDutch West IndianEastern EuropeanEcuadorianEgyptianEnglishEstonianEthiopianEuropeanFijianFilipinoFinnishFrenchFrench American IndianFrench CanadianGermanGerman RussianGhanaianGreekGuamanian/ChamorroGuatemalanGuyaneseHaitianHmongHonduranHopiHoumaHungarianIcelanderIndian (Asian)IndonesianInupiatIranianIraqiIrishIroquoisIsraeliItalianJamaicanJapaneseJordanianKenyanKiowaKoreanLaotianLatvianLebaneseLiberianLithuanianLumbeeLuxembourgerMacedonianMalaysianMalteseMarshalleseMenomineeMexicanMexican American IndianMongolianMoroccanNative HawaiianNavajoNepaleseNew ZealanderNicaraguanNigerianNorthern EuropeanNorwegianOkinawanOsageOttawaPaiutePakistaniPalestinianPanamanianParaguayanPennsylvania GermanPeruvianPimaPolishPortuguesePotawatomiPuebloPuerto RicanPuget Sound SalishRomanianRussianSalvadoranSamoanScandinavianScotch-IrishScottishSeminoleSenegaleseSerbianShoshoneSierra LeoneanSiouxSlavicSlovakSloveneSomaliSouth AfricanSouth AmericanSouth American IndianSoviet UnionSpaniardSpanishSpanish AmericanSpanish American IndianSri LankanSubsaharan AfricanSudaneseSwedishSwissSyrianTaiwaneseThaiTlingit-HaidaTohono O'OdhamTonganTrinidadian and TobagonianTsimshianTurkishU.S. Virgin IslanderUgandanUkrainianUruguayanUteVenezuelanVietnameseWelshWest IndianYakamaYaquiYugoslavianYumanYup'ikZimbabwean
Immigration
NonimmigrantsImmigrantsAfghanistanAfricaAlbaniaArgentinaArmeniaAsiaAustraliaAustriaBahamasBangladeshBarbadosBelarusBelgiumBelizeBoliviaBosnia and HerzegovinaBrazilBulgariaBurma/MyanmarCabo VerdeCambodiaCameroonCanadaCaribbeanCentral AmericaChileChinaColombiaCongoCosta RicaCroatiaCubaCzechoslovakiaDenmarkDominicaDominican RepublicEastern AfricaEastern AsiaEastern EuropeEcuadorEgyptEl SalvadorEnglandEritreaEthiopiaEuropeFijiFranceGermanyGhanaGreeceGrenadaGuatemalaGuyanaHaitiHondurasHong KongHungaryIndiaIndonesiaIranIraqIrelandIsraelItalyJamaicaJapanJordanKazakhstanKenyaKoreaKuwaitLaosLatin AmericaLatviaLebanonLiberiaLithuaniaMalaysiaMexicoMicronesiaMiddle AfricaMoldovaMoroccoNepalNetherlandsNicaraguaNigeriaNorth AmericaNorth MacedoniaNorthern AfricaNorthern EuropeNorwayOceaniaPakistanPanamaPeruPhilippinesPolandPortugalRomaniaRussiaSaudi ArabiaScotlandSenegalSerbiaSierra LeoneSingaporeSomaliaSouth AfricaSouth AmericaSouth Central AsiaSouth Eastern AsiaSouthern EuropeSpainSri LankaSt. Vincent and the GrenadinesSudanSwedenSwitzerlandSyriaTaiwanThailandTrinidad and TobagoTurkeyUgandaUkraineUruguayUzbekistanVenezuelaVietnamWest IndiesWestern AfricaWestern AsiaWestern EuropeYemenZaireZimbabweAzores
Select to Compare
Race
Ancestry
AfghanAfricanAlaska NativeAlaskan AthabascanAlbanianAleutAlsatianAmericanApacheArabArapahoArgentineanArmenianAssyrian/Chaldean/SyriacAustralianAustrianBahamianBangladeshiBarbadianBasqueBelgianBelizeanBermudanBhutaneseBlackfeetBolivianBrazilianBritishBritish West IndianBulgarianBurmeseCajunCambodianCanadianCape VerdeanCarpatho RusynCelticCentral AmericanCentral American IndianCherokeeCheyenneChickasawChileanChineseChippewaChoctawColombianColvilleComancheCosta RicanCreekCroatianCrowCubanCypriotCzechCzechoslovakianDanishDelawareDominicanDutchDutch West IndianEastern EuropeanEcuadorianEgyptianEnglishEstonianEthiopianEuropeanFijianFilipinoFinnishFrenchFrench American IndianFrench CanadianGermanGerman RussianGhanaianGreekGuamanian/ChamorroGuatemalanGuyaneseHaitianHmongHonduranHopiHoumaHungarianIcelanderIndian (Asian)IndonesianInupiatIranianIraqiIrishIroquoisIsraeliItalianJamaicanJapaneseJordanianKenyanKiowaKoreanLaotianLatvianLebaneseLiberianLithuanianLumbeeLuxembourgerMacedonianMalaysianMalteseMarshalleseMenomineeMexicanMexican American IndianMongolianMoroccanNative HawaiianNavajoNepaleseNew ZealanderNicaraguanNigerianNorthern EuropeanNorwegianOkinawanOsageOttawaPaiutePakistaniPalestinianPanamanianParaguayanPennsylvania GermanPeruvianPimaPolishPortuguesePotawatomiPuebloPuerto RicanPuget Sound SalishRomanianRussianSalvadoranSamoanScandinavianScotch-IrishScottishSeminoleSenegaleseSerbianShoshoneSierra LeoneanSiouxSlavicSlovakSloveneSomaliSouth AfricanSouth AmericanSouth American IndianSoviet UnionSpaniardSpanishSpanish AmericanSpanish American IndianSri LankanSubsaharan AfricanSudaneseSwedishSwissSyrianTaiwaneseThaiTlingit-HaidaTohono O'OdhamTonganTrinidadian and TobagonianTsimshianTurkishU.S. Virgin IslanderUgandanUkrainianUruguayanUteVenezuelanVietnameseWelshWest IndianYakamaYaquiYugoslavianYumanYup'ikZimbabwean
Immigration
NonimmigrantsImmigrantsAfghanistanAfricaAlbaniaArgentinaArmeniaAsiaAustraliaAustriaBahamasBangladeshBarbadosBelarusBelgiumBelizeBoliviaBosnia and HerzegovinaBrazilBulgariaBurma/MyanmarCabo VerdeCambodiaCameroonCanadaCaribbeanCentral AmericaChileChinaColombiaCongoCosta RicaCroatiaCubaCzechoslovakiaDenmarkDominicaDominican RepublicEastern AfricaEastern AsiaEastern EuropeEcuadorEgyptEl SalvadorEnglandEritreaEthiopiaEuropeFijiFranceGermanyGhanaGreeceGrenadaGuatemalaGuyanaHaitiHondurasHong KongHungaryIndiaIndonesiaIranIraqIrelandIsraelItalyJamaicaJapanJordanKazakhstanKenyaKoreaKuwaitLaosLatin AmericaLatviaLebanonLiberiaLithuaniaMalaysiaMexicoMicronesiaMiddle AfricaMoldovaMoroccoNepalNetherlandsNicaraguaNigeriaNorth AmericaNorth MacedoniaNorthern AfricaNorthern EuropeNorwayOceaniaPakistanPanamaPeruPhilippinesPolandPortugalRomaniaRussiaSaudi ArabiaScotlandSenegalSerbiaSierra LeoneSingaporeSomaliaSouth AfricaSouth AmericaSouth Central AsiaSouth Eastern AsiaSouthern EuropeSpainSri LankaSt. Vincent and the GrenadinesSudanSwedenSwitzerlandSyriaTaiwanThailandTrinidad and TobagoTurkeyUgandaUkraineUruguayUzbekistanVenezuelaVietnamWest IndiesWestern AfricaWestern AsiaWestern EuropeYemenZaireZimbabweAzores
Self-Care Disability
Income
Poverty
Unemployment
Labor Participation
Family Structure
Vehicle Availability
Education Level
Disability

Cree Self-Care Disability
Tragic

2.8%
SELF-CARE DISABILITY
0.0/ 100
METRIC RATING
304th/ 347
METRIC RANK

Cree Self-Care Disability Correlation Chart

The statistical analysis conducted on geographies consisting of 76,186,163 people shows a mild positive correlation between the proportion of Cree and percentage of population with self-care disability in the United States with a correlation coefficient (R) of 0.326 and weighted average of 2.8%. On average, for every 1% (one percent) increase in Cree within a typical geography, there is an increase of 0.16% in percentage of population with self-care disability.
Cree Self-Care Disability
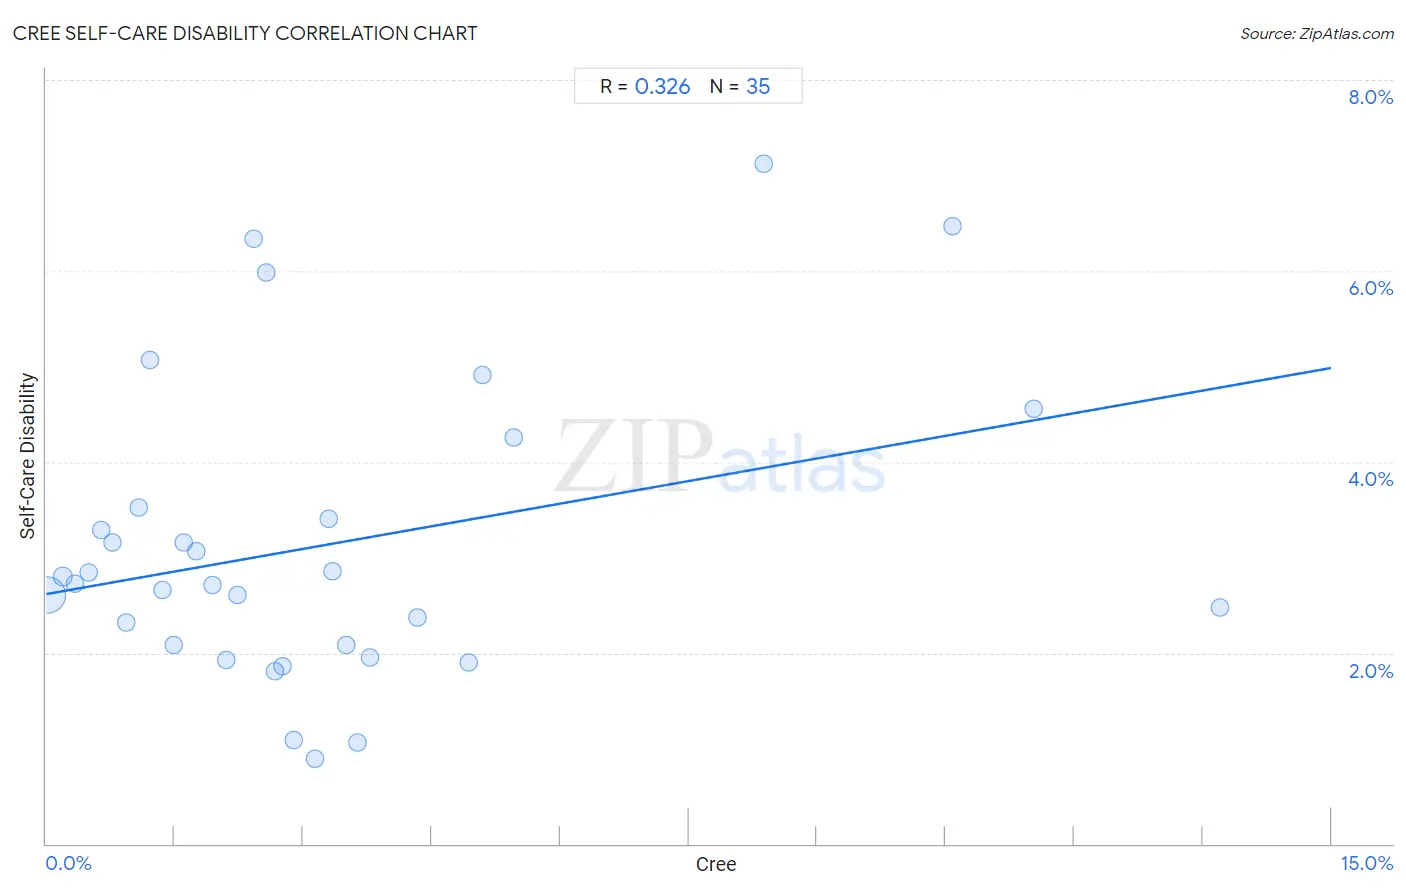
It is essential to understand that the correlation between the percentage of Cree and percentage of population with self-care disability does not imply a direct cause-and-effect relationship. It remains uncertain whether the presence of Cree influences an upward or downward trend in the level of percentage of population with self-care disability within an area, or if Cree simply ended up residing in those areas with higher or lower levels of percentage of population with self-care disability due to other factors.

Demographics Similar to Cree by Self-Care Disability

In terms of self-care disability, the demographic groups most similar to Cree are Immigrants from West Indies (2.8%, a difference of 0.050%), Immigrants from Belize (2.8%, a difference of 0.16%), Immigrants from St. Vincent and the Grenadines (2.8%, a difference of 0.30%), Pima (2.8%, a difference of 0.34%), and Immigrants from Fiji (2.8%, a difference of 0.43%).
DemographicsRating | RankSelf-Care Disability
West Indians
0.0
/100
|
#297
Tragic
2.8%
Americans
0.0
/100
|
#298
Tragic
2.8%
Immigrants from Guyana
0.0
/100
|
#299
Tragic
2.8%
Immigrants from Fiji
0.0
/100
|
#300
Tragic
2.8%
Pima
0.0
/100
|
#301
Tragic
2.8%
Immigrants from St. Vincent and the Grenadines
0.0
/100
|
#302
Tragic
2.8%
Immigrants from Belize
0.0
/100
|
#303
Tragic
2.8%
Cree
0.0
/100
|
#304
Tragic
2.8%
Immigrants from West Indies
0.0
/100
|
#305
Tragic
2.8%
Aleuts
0.0
/100
|
#306
Tragic
2.8%
Natives/Alaskans
0.0
/100
|
#307
Tragic
2.8%
Immigrants from Grenada
0.0
/100
|
#308
Tragic
2.8%
Bangladeshis
0.0
/100
|
#309
Tragic
2.8%
British West Indians
0.0
/100
|
#310
Tragic
2.8%
Puget Sound Salish
0.0
/100
|
#311
Tragic
2.8%

Cree Self-Care Disability Correlation Summary

MeasurementCree DataSelf-Care Disability Data
Minimum0.016%0.89%
Maximum13.7%7.1%
Range13.7%6.2%
Mean3.3%3.1%
Median2.6%2.7%
Interquartile 25% (IQ1)1.2%2.1%
Interquartile 75% (IQ3)3.8%3.5%
Interquartile Range (IQR)2.6%1.4%
Standard Deviation (Sample)3.2%1.6%
Standard Deviation (Population)3.2%1.5%

Correlation Details

Cree PercentileSample SizeSelf-Care Disability
[
0.0%
-
0.5%
]
0.016%
72,697,8932.6%
[
0.0%
-
0.5%
]
0.19%
2,202,9092.8%
[
0.0%
-
0.5%
]
0.33%
617,4992.7%
[
0.0%
-
0.5%
]
0.49%
309,7222.8%
[
0.5%
-
1.0%
]
0.65%
81,7543.3%
[
0.5%
-
1.0%
]
0.77%
90,8693.2%
[
0.5%
-
1.0%
]
0.93%
36,3042.3%
[
1.0%
-
1.5%
]
1.08%
4,9153.5%
[
1.0%
-
1.5%
]
1.21%
19,6995.1%
[
1.0%
-
1.5%
]
1.36%
22,7582.7%
[
1.0%
-
1.5%
]
1.49%
14,9302.1%
[
1.5%
-
2.0%
]
1.60%
33,7803.2%
[
1.5%
-
2.0%
]
1.75%
4,3553.1%
[
1.5%
-
2.0%
]
1.95%
9,7112.7%
[
2.0%
-
2.5%
]
2.10%
1,5241.9%
[
2.0%
-
2.5%
]
2.23%
3,2232.6%
[
2.0%
-
2.5%
]
2.42%
3,2256.3%
[
2.5%
-
3.0%
]
2.56%
2346.0%
[
2.5%
-
3.0%
]
2.67%
6,1461.8%
[
2.5%
-
3.0%
]
2.76%
1,0151.9%
[
2.5%
-
3.0%
]
2.89%
6931.1%
[
3.0%
-
3.5%
]
3.13%
4,1180.89%
[
3.0%
-
3.5%
]
3.30%
3,8133.4%
[
3.0%
-
3.5%
]
3.34%
5992.9%
[
3.5%
-
4.0%
]
3.51%
1,8252.1%
[
3.5%
-
4.0%
]
3.64%
1,4031.1%
[
3.5%
-
4.0%
]
3.77%
2122.0%
[
4.0%
-
4.5%
]
4.33%
5542.4%
[
4.5%
-
5.0%
]
4.93%
6901.9%
[
5.0%
-
5.5%
]
5.10%
2,6294.9%
[
5.0%
-
5.5%
]
5.46%
3,6624.2%
[
8.0%
-
8.5%
]
8.38%
1,5997.1%
[
10.5%
-
11.0%
]
10.57%
5776.5%
[
11.5%
-
12.0%
]
11.53%
9374.6%
[
13.5%
-
14.0%
]
13.70%
3872.5%