Cree Female Disability
COMPARE
Cree
Select to Compare
Female Disability
Cree Female Disability
13.7%
DISABILITY | FEMALES
0.0/ 100
METRIC RATING
308th/ 347
METRIC RANK
Cree Female Disability Correlation Chart
The statistical analysis conducted on geographies consisting of 76,204,869 people shows a slight negative correlation between the proportion of Cree and percentage of females with a disability in the United States with a correlation coefficient (R) of -0.056 and weighted average of 13.7%. On average, for every 1% (one percent) increase in Cree within a typical geography, there is a decrease of 0.057% in percentage of females with a disability.
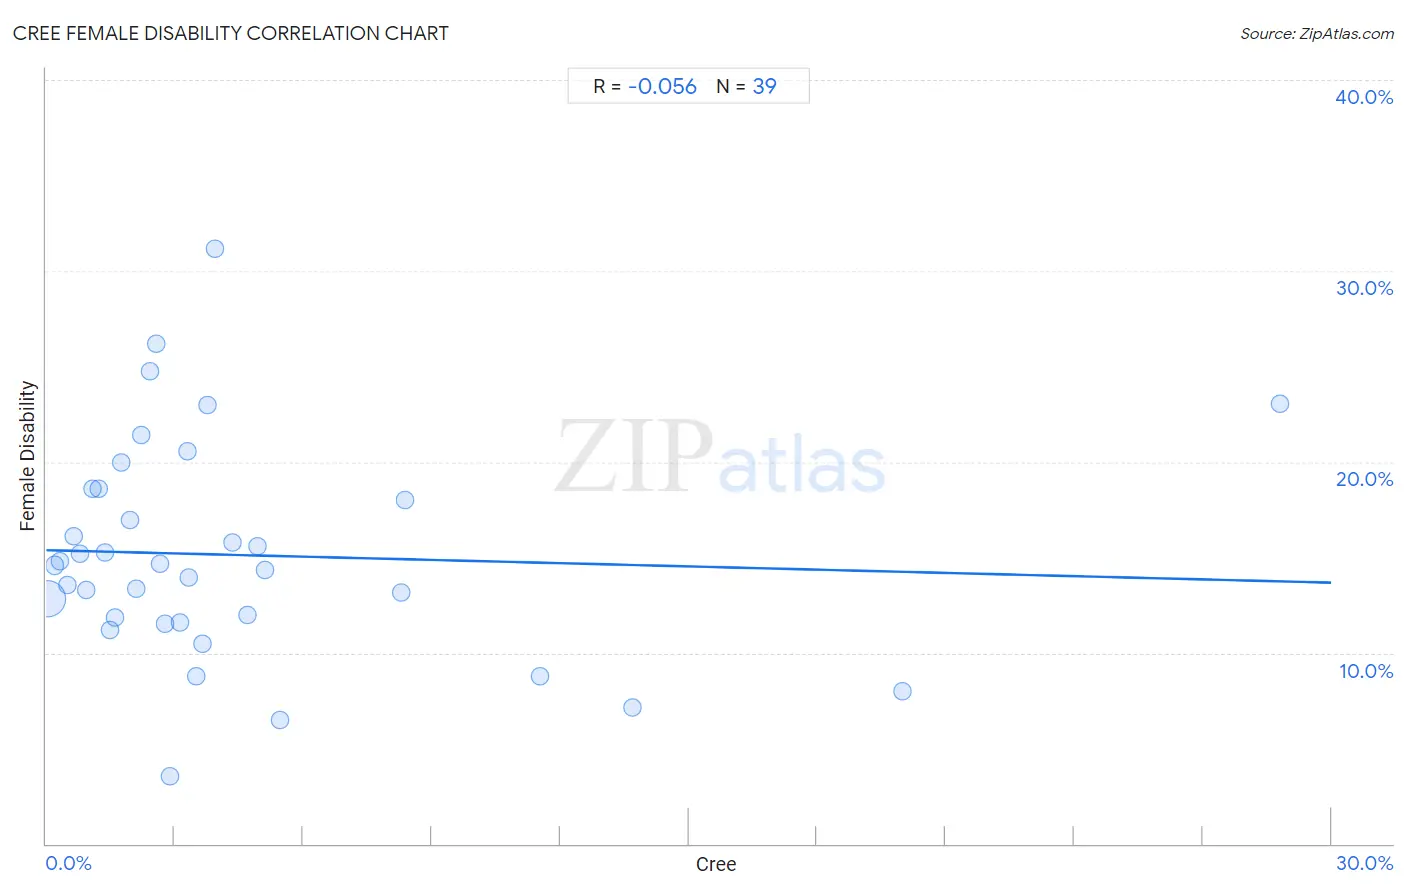
It is essential to understand that the correlation between the percentage of Cree and percentage of females with a disability does not imply a direct cause-and-effect relationship. It remains uncertain whether the presence of Cree influences an upward or downward trend in the level of percentage of females with a disability within an area, or if Cree simply ended up residing in those areas with higher or lower levels of percentage of females with a disability due to other factors.
Demographics Similar to Cree by Female Disability
In terms of female disability, the demographic groups most similar to Cree are French American Indian (13.7%, a difference of 0.060%), Apache (13.7%, a difference of 0.18%), Central American Indian (13.6%, a difference of 0.46%), Hopi (13.7%, a difference of 0.46%), and French Canadian (13.6%, a difference of 0.75%).
| Demographics | Rating | Rank | Female Disability |
| Africans | 0.0 /100 | #301 | Tragic 13.4% |
| Scotch-Irish | 0.0 /100 | #302 | Tragic 13.4% |
| Immigrants from Portugal | 0.0 /100 | #303 | Tragic 13.5% |
| Immigrants from Micronesia | 0.0 /100 | #304 | Tragic 13.5% |
| Dominicans | 0.0 /100 | #305 | Tragic 13.5% |
| French Canadians | 0.0 /100 | #306 | Tragic 13.6% |
| Central American Indians | 0.0 /100 | #307 | Tragic 13.6% |
| Cree | 0.0 /100 | #308 | Tragic 13.7% |
| French American Indians | 0.0 /100 | #309 | Tragic 13.7% |
| Apache | 0.0 /100 | #310 | Tragic 13.7% |
| Hopi | 0.0 /100 | #311 | Tragic 13.7% |
| Delaware | 0.0 /100 | #312 | Tragic 13.8% |
| Blackfeet | 0.0 /100 | #313 | Tragic 13.8% |
| Puget Sound Salish | 0.0 /100 | #314 | Tragic 13.8% |
| Alaskan Athabascans | 0.0 /100 | #315 | Tragic 13.9% |
Cree Female Disability Correlation Summary
| Measurement | Cree Data | Female Disability Data |
| Minimum | 0.016% | 3.6% |
| Maximum | 28.8% | 31.2% |
| Range | 28.8% | 27.6% |
| Mean | 4.4% | 15.1% |
| Median | 2.8% | 14.6% |
| Interquartile 25% (IQ1) | 1.4% | 11.6% |
| Interquartile 75% (IQ3) | 4.7% | 18.6% |
| Interquartile Range (IQR) | 3.3% | 7.0% |
| Standard Deviation (Sample) | 5.6% | 5.7% |
| Standard Deviation (Population) | 5.6% | 5.6% |
Correlation Details
| Cree Percentile | Sample Size | Female Disability |
[ 0.0% - 0.5% ] 0.016% | 72,697,893 | 12.8% |
[ 0.0% - 0.5% ] 0.19% | 2,206,464 | 14.6% |
[ 0.0% - 0.5% ] 0.33% | 618,037 | 14.8% |
[ 0.0% - 0.5% ] 0.49% | 319,752 | 13.5% |
[ 0.5% - 1.0% ] 0.65% | 84,464 | 16.1% |
[ 0.5% - 1.0% ] 0.77% | 91,119 | 15.2% |
[ 0.5% - 1.0% ] 0.93% | 36,304 | 13.3% |
[ 1.0% - 1.5% ] 1.08% | 4,915 | 18.6% |
[ 1.0% - 1.5% ] 1.21% | 19,699 | 18.6% |
[ 1.0% - 1.5% ] 1.36% | 22,910 | 15.3% |
[ 1.0% - 1.5% ] 1.49% | 14,930 | 11.2% |
[ 1.5% - 2.0% ] 1.60% | 33,780 | 11.9% |
[ 1.5% - 2.0% ] 1.75% | 4,355 | 20.0% |
[ 1.5% - 2.0% ] 1.95% | 9,711 | 16.9% |
[ 2.0% - 2.5% ] 2.10% | 1,524 | 13.4% |
[ 2.0% - 2.5% ] 2.23% | 3,494 | 21.4% |
[ 2.0% - 2.5% ] 2.42% | 3,225 | 24.8% |
[ 2.5% - 3.0% ] 2.56% | 234 | 26.2% |
[ 2.5% - 3.0% ] 2.67% | 6,146 | 14.6% |
[ 2.5% - 3.0% ] 2.76% | 1,015 | 11.5% |
[ 2.5% - 3.0% ] 2.89% | 693 | 3.6% |
[ 3.0% - 3.5% ] 3.13% | 4,118 | 11.6% |
[ 3.0% - 3.5% ] 3.30% | 3,813 | 20.5% |
[ 3.0% - 3.5% ] 3.34% | 599 | 13.9% |
[ 3.5% - 4.0% ] 3.51% | 1,825 | 8.8% |
[ 3.5% - 4.0% ] 3.64% | 1,403 | 10.5% |
[ 3.5% - 4.0% ] 3.77% | 212 | 23.0% |
[ 3.5% - 4.0% ] 3.93% | 789 | 31.2% |
[ 4.0% - 4.5% ] 4.35% | 689 | 15.8% |
[ 4.5% - 5.0% ] 4.69% | 469 | 12.0% |
[ 4.5% - 5.0% ] 4.93% | 690 | 15.6% |
[ 5.0% - 5.5% ] 5.10% | 2,629 | 14.3% |
[ 5.0% - 5.5% ] 5.46% | 3,662 | 6.5% |
[ 8.0% - 8.5% ] 8.30% | 265 | 13.2% |
[ 8.0% - 8.5% ] 8.38% | 1,599 | 18.0% |
[ 11.5% - 12.0% ] 11.53% | 937 | 8.7% |
[ 13.5% - 14.0% ] 13.70% | 387 | 7.1% |
[ 20.0% - 20.5% ] 20.00% | 60 | 8.0% |
[ 28.5% - 29.0% ] 28.81% | 59 | 23.1% |