Cree 4 or more Vehicles in Household
COMPARE
Cree
Select to Compare
4 or more Vehicles in Household
Cree 4 or more Vehicles in Household
7.2%
4+ VEHICLES AVAILABLE
99.7/ 100
METRIC RATING
85th/ 347
METRIC RANK
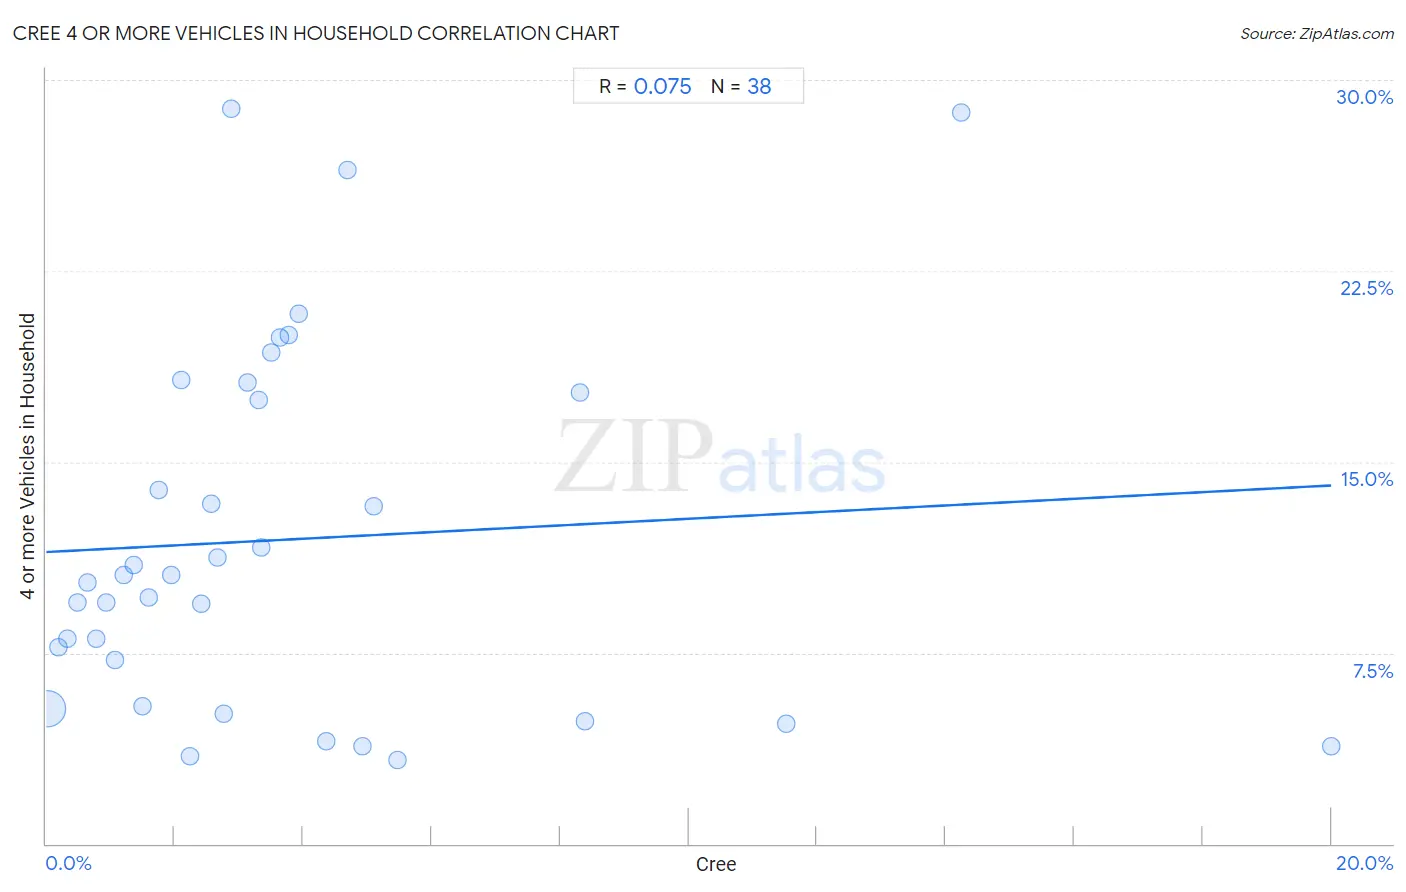
Cree 4 or more Vehicles in Household Correlation Chart
The statistical analysis conducted on geographies consisting of 76,129,414 people shows a slight positive correlation between the proportion of Cree and percentage of households with 4 or more vehicles available in the United States with a correlation coefficient (R) of 0.075 and weighted average of 7.2%. On average, for every 1% (one percent) increase in Cree within a typical geography, there is an increase of 0.13% in percentage of households with 4 or more vehicles available.
It is essential to understand that the correlation between the percentage of Cree and percentage of households with 4 or more vehicles available does not imply a direct cause-and-effect relationship. It remains uncertain whether the presence of Cree influences an upward or downward trend in the level of percentage of households with 4 or more vehicles available within an area, or if Cree simply ended up residing in those areas with higher or lower levels of percentage of households with 4 or more vehicles available due to other factors.
Demographics Similar to Cree by 4 or more Vehicles in Household
In terms of 4 or more vehicles in household, the demographic groups most similar to Cree are Afghan (7.3%, a difference of 0.17%), Immigrants from Indonesia (7.2%, a difference of 0.18%), Delaware (7.2%, a difference of 0.24%), Nonimmigrants (7.2%, a difference of 0.26%), and Potawatomi (7.3%, a difference of 0.49%).
| Demographics | Rating | Rank | 4 or more Vehicles in Household |
| Whites/Caucasians | 99.8 /100 | #78 | Exceptional 7.4% |
| Czechs | 99.8 /100 | #79 | Exceptional 7.4% |
| Alaska Natives | 99.8 /100 | #80 | Exceptional 7.3% |
| Finns | 99.8 /100 | #81 | Exceptional 7.3% |
| Northern Europeans | 99.8 /100 | #82 | Exceptional 7.3% |
| Potawatomi | 99.7 /100 | #83 | Exceptional 7.3% |
| Afghans | 99.7 /100 | #84 | Exceptional 7.3% |
| Cree | 99.7 /100 | #85 | Exceptional 7.2% |
| Immigrants from Indonesia | 99.6 /100 | #86 | Exceptional 7.2% |
| Delaware | 99.6 /100 | #87 | Exceptional 7.2% |
| Nonimmigrants | 99.6 /100 | #88 | Exceptional 7.2% |
| British | 99.6 /100 | #89 | Exceptional 7.2% |
| Creek | 99.6 /100 | #90 | Exceptional 7.2% |
| Assyrians/Chaldeans/Syriacs | 99.4 /100 | #91 | Exceptional 7.2% |
| Immigrants from Latin America | 99.4 /100 | #92 | Exceptional 7.1% |
Cree 4 or more Vehicles in Household Correlation Summary
| Measurement | Cree Data | 4 or more Vehicles in Household Data |
| Minimum | 0.016% | 3.3% |
| Maximum | 20.0% | 28.9% |
| Range | 20.0% | 25.5% |
| Mean | 3.8% | 11.9% |
| Median | 2.7% | 10.4% |
| Interquartile 25% (IQ1) | 1.4% | 5.4% |
| Interquartile 75% (IQ3) | 4.4% | 17.7% |
| Interquartile Range (IQR) | 3.0% | 12.3% |
| Standard Deviation (Sample) | 4.1% | 7.1% |
| Standard Deviation (Population) | 4.0% | 7.0% |
Correlation Details
| Cree Percentile | Sample Size | 4 or more Vehicles in Household |
[ 0.0% - 0.5% ] 0.016% | 72,641,928 | 5.3% |
[ 0.0% - 0.5% ] 0.19% | 2,204,204 | 7.7% |
[ 0.0% - 0.5% ] 0.33% | 603,408 | 8.1% |
[ 0.0% - 0.5% ] 0.49% | 319,073 | 9.5% |
[ 0.5% - 1.0% ] 0.65% | 82,801 | 10.3% |
[ 0.5% - 1.0% ] 0.77% | 91,119 | 8.1% |
[ 0.5% - 1.0% ] 0.93% | 36,304 | 9.5% |
[ 1.0% - 1.5% ] 1.08% | 4,915 | 7.2% |
[ 1.0% - 1.5% ] 1.21% | 19,699 | 10.6% |
[ 1.0% - 1.5% ] 1.36% | 22,325 | 10.9% |
[ 1.0% - 1.5% ] 1.49% | 14,930 | 5.4% |
[ 1.5% - 2.0% ] 1.60% | 33,780 | 9.6% |
[ 1.5% - 2.0% ] 1.75% | 4,355 | 13.9% |
[ 1.5% - 2.0% ] 1.95% | 9,711 | 10.6% |
[ 2.0% - 2.5% ] 2.10% | 1,524 | 18.2% |
[ 2.0% - 2.5% ] 2.23% | 3,494 | 3.4% |
[ 2.0% - 2.5% ] 2.42% | 3,225 | 9.4% |
[ 2.5% - 3.0% ] 2.56% | 234 | 13.3% |
[ 2.5% - 3.0% ] 2.67% | 6,146 | 11.3% |
[ 2.5% - 3.0% ] 2.76% | 1,015 | 5.1% |
[ 2.5% - 3.0% ] 2.89% | 693 | 28.9% |
[ 3.0% - 3.5% ] 3.13% | 4,118 | 18.1% |
[ 3.0% - 3.5% ] 3.30% | 3,813 | 17.4% |
[ 3.0% - 3.5% ] 3.34% | 599 | 11.6% |
[ 3.5% - 4.0% ] 3.51% | 1,825 | 19.3% |
[ 3.5% - 4.0% ] 3.64% | 1,403 | 19.9% |
[ 3.5% - 4.0% ] 3.77% | 212 | 20.0% |
[ 3.5% - 4.0% ] 3.93% | 789 | 20.8% |
[ 4.0% - 4.5% ] 4.35% | 689 | 4.0% |
[ 4.5% - 5.0% ] 4.69% | 469 | 26.4% |
[ 4.5% - 5.0% ] 4.93% | 690 | 3.8% |
[ 5.0% - 5.5% ] 5.10% | 2,629 | 13.2% |
[ 5.0% - 5.5% ] 5.46% | 3,662 | 3.3% |
[ 8.0% - 8.5% ] 8.30% | 265 | 17.7% |
[ 8.0% - 8.5% ] 8.38% | 1,599 | 4.8% |
[ 11.5% - 12.0% ] 11.53% | 937 | 4.7% |
[ 14.0% - 14.5% ] 14.25% | 772 | 28.7% |
[ 20.0% - 20.5% ] 20.00% | 60 | 3.8% |