Cambodian College, 1 year or more
COMPARE
Cambodian
Select to Compare
College, 1 year or more
Cambodian College, 1 year or more
66.7%
COLLEGE, 1 YEAR OR MORE
100.0/ 100
METRIC RATING
15th/ 347
METRIC RANK
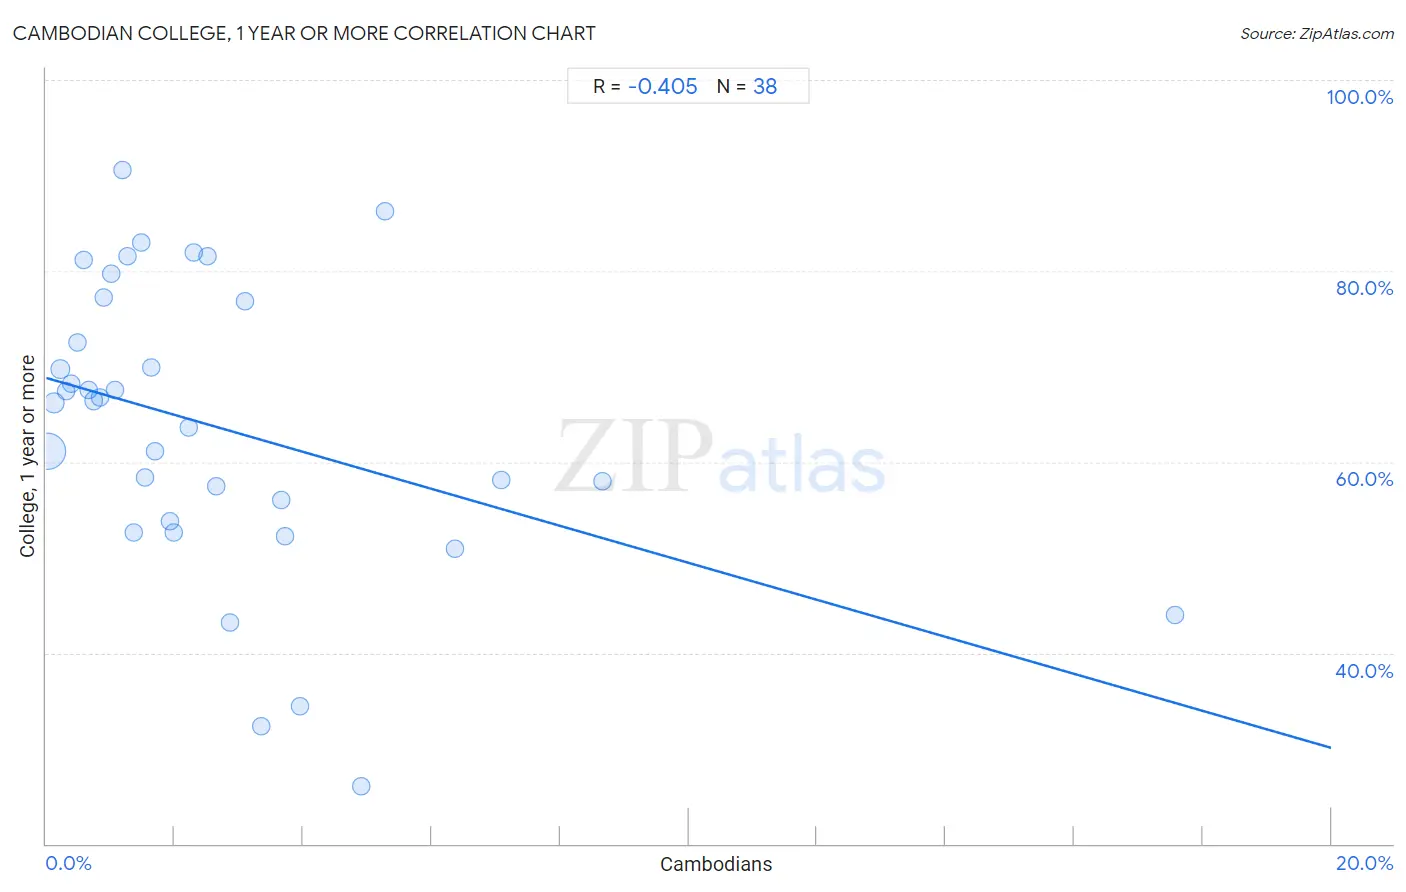
Cambodian College, 1 year or more Correlation Chart
The statistical analysis conducted on geographies consisting of 102,514,976 people shows a moderate negative correlation between the proportion of Cambodians and percentage of population with at least college, 1 year or more education in the United States with a correlation coefficient (R) of -0.405 and weighted average of 66.7%. On average, for every 1% (one percent) increase in Cambodians within a typical geography, there is a decrease of 1.9% in percentage of population with at least college, 1 year or more education.
It is essential to understand that the correlation between the percentage of Cambodians and percentage of population with at least college, 1 year or more education does not imply a direct cause-and-effect relationship. It remains uncertain whether the presence of Cambodians influences an upward or downward trend in the level of percentage of population with at least college, 1 year or more education within an area, or if Cambodians simply ended up residing in those areas with higher or lower levels of percentage of population with at least college, 1 year or more education due to other factors.
Demographics Similar to Cambodians by College, 1 year or more
In terms of college, 1 year or more, the demographic groups most similar to Cambodians are Burmese (66.7%, a difference of 0.0%), Immigrants from Japan (66.7%, a difference of 0.030%), Immigrants from Eastern Asia (66.6%, a difference of 0.15%), Immigrants from Sweden (66.8%, a difference of 0.19%), and Eastern European (66.6%, a difference of 0.22%).
| Demographics | Rating | Rank | College, 1 year or more |
| Thais | 100.0 /100 | #8 | Exceptional 68.6% |
| Immigrants from Israel | 100.0 /100 | #9 | Exceptional 67.8% |
| Immigrants from Australia | 100.0 /100 | #10 | Exceptional 67.7% |
| Immigrants from South Central Asia | 100.0 /100 | #11 | Exceptional 67.1% |
| Cypriots | 100.0 /100 | #12 | Exceptional 67.0% |
| Immigrants from Sweden | 100.0 /100 | #13 | Exceptional 66.8% |
| Burmese | 100.0 /100 | #14 | Exceptional 66.7% |
| Cambodians | 100.0 /100 | #15 | Exceptional 66.7% |
| Immigrants from Japan | 100.0 /100 | #16 | Exceptional 66.7% |
| Immigrants from Eastern Asia | 100.0 /100 | #17 | Exceptional 66.6% |
| Eastern Europeans | 100.0 /100 | #18 | Exceptional 66.6% |
| Immigrants from Switzerland | 100.0 /100 | #19 | Exceptional 66.5% |
| Immigrants from Korea | 100.0 /100 | #20 | Exceptional 66.5% |
| Immigrants from Hong Kong | 100.0 /100 | #21 | Exceptional 66.4% |
| Soviet Union | 100.0 /100 | #22 | Exceptional 66.4% |
Cambodian College, 1 year or more Correlation Summary
| Measurement | Cambodian Data | College, 1 year or more Data |
| Minimum | 0.024% | 26.0% |
| Maximum | 17.6% | 90.6% |
| Range | 17.6% | 64.6% |
| Mean | 2.7% | 63.6% |
| Median | 1.7% | 66.3% |
| Interquartile 25% (IQ1) | 0.83% | 53.8% |
| Interquartile 75% (IQ3) | 3.4% | 76.8% |
| Interquartile Range (IQR) | 2.5% | 23.0% |
| Standard Deviation (Sample) | 3.2% | 15.3% |
| Standard Deviation (Population) | 3.2% | 15.1% |
Correlation Details
| Cambodian Percentile | Sample Size | College, 1 year or more |
[ 0.0% - 0.5% ] 0.024% | 87,243,968 | 61.1% |
[ 0.0% - 0.5% ] 0.12% | 8,307,004 | 66.2% |
[ 0.0% - 0.5% ] 0.22% | 2,497,760 | 69.7% |
[ 0.0% - 0.5% ] 0.30% | 1,482,350 | 67.4% |
[ 0.0% - 0.5% ] 0.38% | 712,050 | 68.2% |
[ 0.0% - 0.5% ] 0.48% | 385,886 | 72.5% |
[ 0.5% - 1.0% ] 0.59% | 413,726 | 81.2% |
[ 0.5% - 1.0% ] 0.65% | 411,385 | 67.5% |
[ 0.5% - 1.0% ] 0.74% | 356,632 | 66.4% |
[ 0.5% - 1.0% ] 0.83% | 201,106 | 66.8% |
[ 0.5% - 1.0% ] 0.90% | 94,346 | 77.2% |
[ 1.0% - 1.5% ] 1.01% | 140,025 | 79.7% |
[ 1.0% - 1.5% ] 1.07% | 53,882 | 67.5% |
[ 1.0% - 1.5% ] 1.18% | 23,929 | 90.6% |
[ 1.0% - 1.5% ] 1.26% | 43,843 | 81.6% |
[ 1.0% - 1.5% ] 1.36% | 8,899 | 52.6% |
[ 1.0% - 1.5% ] 1.48% | 1,692 | 83.0% |
[ 1.5% - 2.0% ] 1.54% | 845 | 58.4% |
[ 1.5% - 2.0% ] 1.64% | 6,771 | 69.9% |
[ 1.5% - 2.0% ] 1.68% | 475 | 61.2% |
[ 1.5% - 2.0% ] 1.93% | 1,708 | 53.8% |
[ 1.5% - 2.0% ] 1.99% | 2,367 | 52.6% |
[ 2.0% - 2.5% ] 2.23% | 38,400 | 63.6% |
[ 2.0% - 2.5% ] 2.30% | 25,374 | 81.9% |
[ 2.5% - 3.0% ] 2.51% | 41,058 | 81.5% |
[ 2.5% - 3.0% ] 2.65% | 2,716 | 57.5% |
[ 2.5% - 3.0% ] 2.86% | 3,571 | 43.1% |
[ 3.0% - 3.5% ] 3.10% | 2,933 | 76.8% |
[ 3.0% - 3.5% ] 3.35% | 1,670 | 32.3% |
[ 3.5% - 4.0% ] 3.65% | 2,028 | 56.0% |
[ 3.5% - 4.0% ] 3.71% | 674 | 52.2% |
[ 3.5% - 4.0% ] 3.95% | 1,822 | 34.4% |
[ 4.5% - 5.0% ] 4.90% | 102 | 26.0% |
[ 5.0% - 5.5% ] 5.28% | 587 | 86.2% |
[ 6.0% - 6.5% ] 6.37% | 581 | 51.0% |
[ 7.0% - 7.5% ] 7.09% | 1,411 | 58.1% |
[ 8.5% - 9.0% ] 8.66% | 831 | 58.0% |
[ 17.5% - 18.0% ] 17.57% | 569 | 43.9% |