Cambodian 1 or more Vehicles in Household
COMPARE
Cambodian
Select to Compare
1 or more Vehicles in Household
Cambodian 1 or more Vehicles in Household
89.2%
1+ VEHICLES AVAILABLE
18.9/ 100
METRIC RATING
203rd/ 347
METRIC RANK
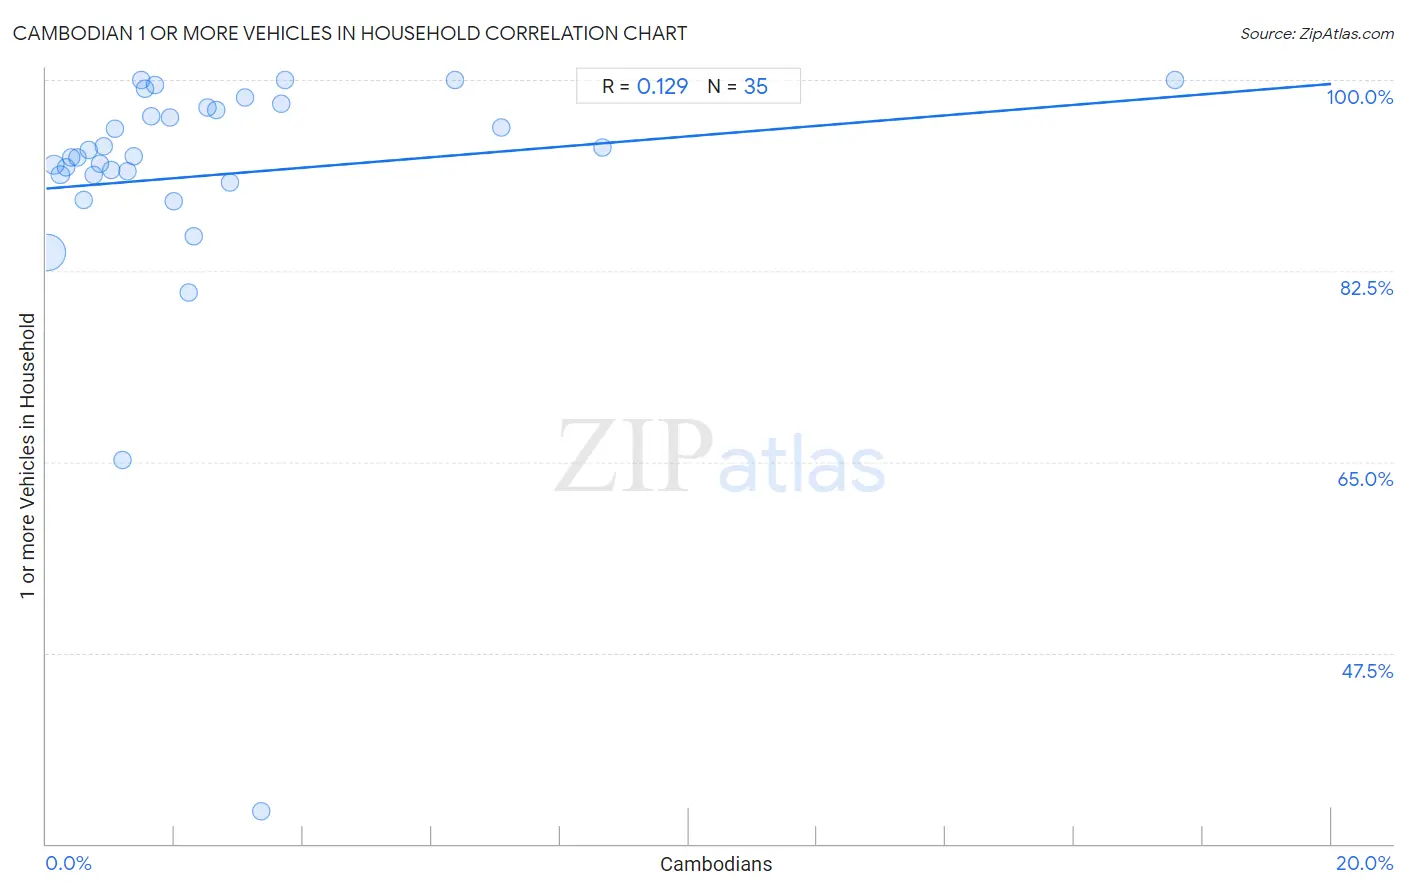
Cambodian 1 or more Vehicles in Household Correlation Chart
The statistical analysis conducted on geographies consisting of 102,492,844 people shows a poor positive correlation between the proportion of Cambodians and percentage of households with 1 or more vehicles available in the United States with a correlation coefficient (R) of 0.129 and weighted average of 89.2%. On average, for every 1% (one percent) increase in Cambodians within a typical geography, there is an increase of 0.48% in percentage of households with 1 or more vehicles available.
It is essential to understand that the correlation between the percentage of Cambodians and percentage of households with 1 or more vehicles available does not imply a direct cause-and-effect relationship. It remains uncertain whether the presence of Cambodians influences an upward or downward trend in the level of percentage of households with 1 or more vehicles available within an area, or if Cambodians simply ended up residing in those areas with higher or lower levels of percentage of households with 1 or more vehicles available due to other factors.
Demographics Similar to Cambodians by 1 or more Vehicles in Household
In terms of 1 or more vehicles in household, the demographic groups most similar to Cambodians are Iroquois (89.2%, a difference of 0.020%), Romanian (89.2%, a difference of 0.020%), Guatemalan (89.2%, a difference of 0.030%), Immigrants from Western Europe (89.2%, a difference of 0.040%), and Central American (89.2%, a difference of 0.060%).
| Demographics | Rating | Rank | 1 or more Vehicles in Household |
| Crow | 24.3 /100 | #196 | Fair 89.3% |
| Immigrants from Sweden | 23.6 /100 | #197 | Fair 89.3% |
| Pennsylvania Germans | 22.9 /100 | #198 | Fair 89.3% |
| Immigrants from Asia | 22.8 /100 | #199 | Fair 89.3% |
| Central Americans | 21.4 /100 | #200 | Fair 89.2% |
| Immigrants from Western Europe | 20.5 /100 | #201 | Fair 89.2% |
| Iroquois | 19.8 /100 | #202 | Poor 89.2% |
| Cambodians | 18.9 /100 | #203 | Poor 89.2% |
| Romanians | 18.2 /100 | #204 | Poor 89.2% |
| Guatemalans | 17.8 /100 | #205 | Poor 89.2% |
| Apache | 16.2 /100 | #206 | Poor 89.1% |
| Immigrants from Denmark | 14.8 /100 | #207 | Poor 89.1% |
| Immigrants from Chile | 14.4 /100 | #208 | Poor 89.1% |
| Immigrants from Italy | 14.0 /100 | #209 | Poor 89.1% |
| Dutch West Indians | 13.5 /100 | #210 | Poor 89.0% |
Cambodian 1 or more Vehicles in Household Correlation Summary
| Measurement | Cambodian Data | 1 or more Vehicles in Household Data |
| Minimum | 0.024% | 33.0% |
| Maximum | 17.6% | 100.0% |
| Range | 17.6% | 67.0% |
| Mean | 2.5% | 91.3% |
| Median | 1.5% | 93.0% |
| Interquartile 25% (IQ1) | 0.74% | 91.3% |
| Interquartile 75% (IQ3) | 2.9% | 97.5% |
| Interquartile Range (IQR) | 2.1% | 6.2% |
| Standard Deviation (Sample) | 3.3% | 12.2% |
| Standard Deviation (Population) | 3.2% | 12.0% |
Correlation Details
| Cambodian Percentile | Sample Size | 1 or more Vehicles in Household |
[ 0.0% - 0.5% ] 0.024% | 87,237,347 | 84.2% |
[ 0.0% - 0.5% ] 0.12% | 8,296,888 | 92.2% |
[ 0.0% - 0.5% ] 0.22% | 2,495,559 | 91.3% |
[ 0.0% - 0.5% ] 0.30% | 1,482,350 | 92.0% |
[ 0.0% - 0.5% ] 0.38% | 712,050 | 92.9% |
[ 0.0% - 0.5% ] 0.48% | 385,886 | 92.9% |
[ 0.5% - 1.0% ] 0.59% | 413,726 | 89.1% |
[ 0.5% - 1.0% ] 0.65% | 411,385 | 93.6% |
[ 0.5% - 1.0% ] 0.74% | 356,632 | 91.3% |
[ 0.5% - 1.0% ] 0.83% | 201,106 | 92.3% |
[ 0.5% - 1.0% ] 0.90% | 94,130 | 94.0% |
[ 1.0% - 1.5% ] 1.01% | 140,025 | 91.8% |
[ 1.0% - 1.5% ] 1.07% | 53,882 | 95.6% |
[ 1.0% - 1.5% ] 1.18% | 23,929 | 65.1% |
[ 1.0% - 1.5% ] 1.26% | 43,376 | 91.6% |
[ 1.0% - 1.5% ] 1.36% | 8,899 | 93.0% |
[ 1.0% - 1.5% ] 1.48% | 1,692 | 100.0% |
[ 1.5% - 2.0% ] 1.54% | 845 | 99.2% |
[ 1.5% - 2.0% ] 1.64% | 6,771 | 96.6% |
[ 1.5% - 2.0% ] 1.68% | 475 | 99.6% |
[ 1.5% - 2.0% ] 1.93% | 1,708 | 96.6% |
[ 1.5% - 2.0% ] 1.99% | 2,367 | 88.8% |
[ 2.0% - 2.5% ] 2.23% | 38,400 | 80.5% |
[ 2.0% - 2.5% ] 2.30% | 25,374 | 85.6% |
[ 2.5% - 3.0% ] 2.51% | 41,058 | 97.5% |
[ 2.5% - 3.0% ] 2.65% | 2,716 | 97.2% |
[ 2.5% - 3.0% ] 2.86% | 3,571 | 90.7% |
[ 3.0% - 3.5% ] 3.10% | 2,933 | 98.4% |
[ 3.0% - 3.5% ] 3.35% | 1,670 | 33.0% |
[ 3.5% - 4.0% ] 3.65% | 2,028 | 97.8% |
[ 3.5% - 4.0% ] 3.71% | 674 | 100.0% |
[ 6.0% - 6.5% ] 6.37% | 581 | 100.0% |
[ 7.0% - 7.5% ] 7.09% | 1,411 | 95.7% |
[ 8.5% - 9.0% ] 8.66% | 831 | 93.8% |
[ 17.5% - 18.0% ] 17.57% | 569 | 100.0% |