Cambodian Female Disability
COMPARE
Cambodian
Select to Compare
Female Disability
Cambodian Female Disability
11.3%
DISABILITY | FEMALES
100.0/ 100
METRIC RATING
44th/ 347
METRIC RANK
Cambodian Female Disability Correlation Chart
The statistical analysis conducted on geographies consisting of 102,507,228 people shows a moderate positive correlation between the proportion of Cambodians and percentage of females with a disability in the United States with a correlation coefficient (R) of 0.436 and weighted average of 11.3%. On average, for every 1% (one percent) increase in Cambodians within a typical geography, there is an increase of 1.0% in percentage of females with a disability.
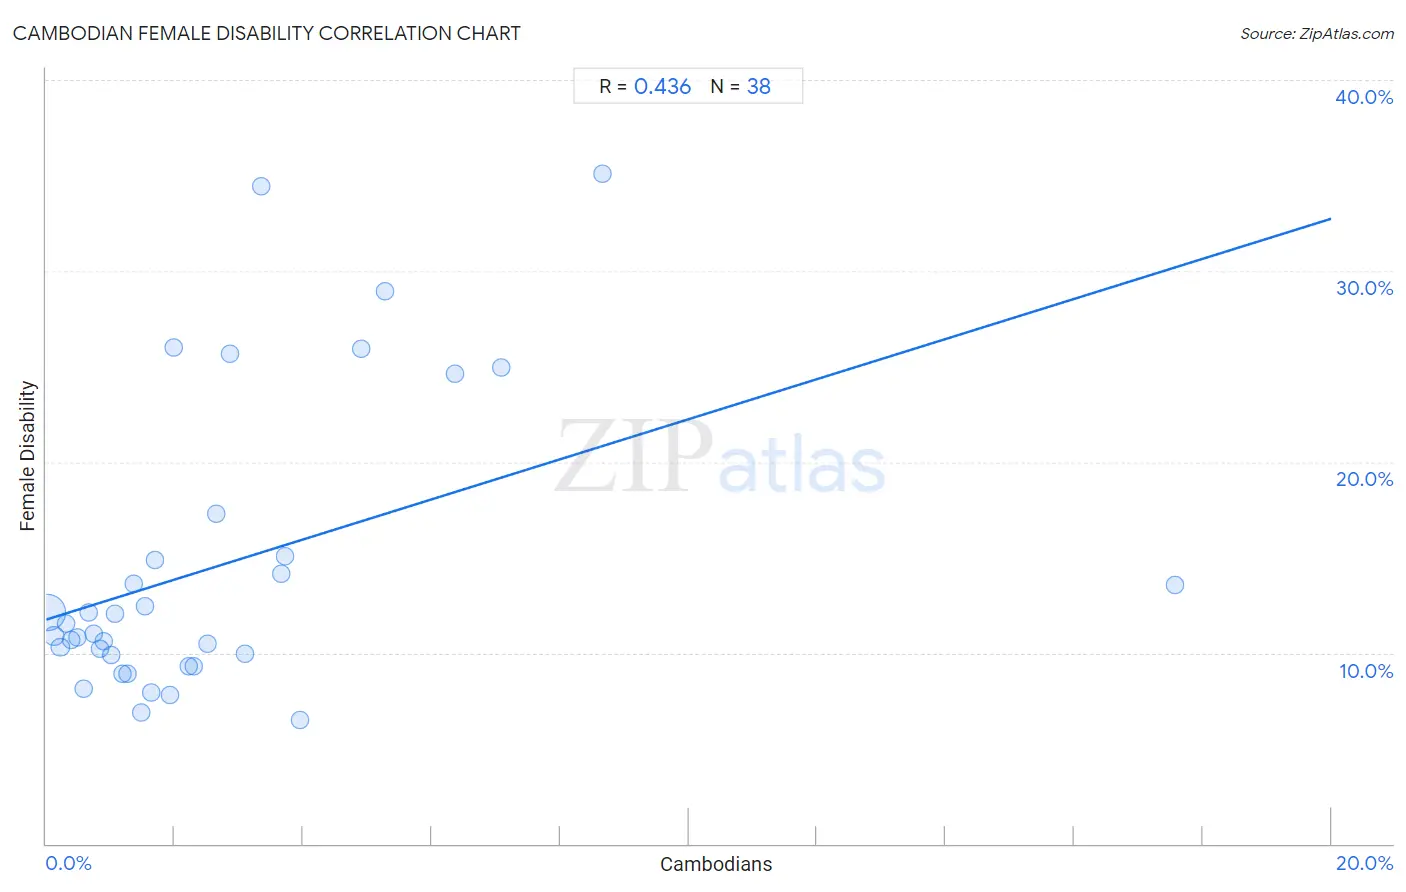
It is essential to understand that the correlation between the percentage of Cambodians and percentage of females with a disability does not imply a direct cause-and-effect relationship. It remains uncertain whether the presence of Cambodians influences an upward or downward trend in the level of percentage of females with a disability within an area, or if Cambodians simply ended up residing in those areas with higher or lower levels of percentage of females with a disability due to other factors.
Demographics Similar to Cambodians by Female Disability
In terms of female disability, the demographic groups most similar to Cambodians are Immigrants from Sweden (11.3%, a difference of 0.040%), Immigrants from Nepal (11.3%, a difference of 0.080%), Jordanian (11.3%, a difference of 0.10%), Zimbabwean (11.3%, a difference of 0.11%), and Tongan (11.3%, a difference of 0.12%).
| Demographics | Rating | Rank | Female Disability |
| Ethiopians | 100.0 /100 | #37 | Exceptional 11.2% |
| Immigrants from Ethiopia | 100.0 /100 | #38 | Exceptional 11.2% |
| Immigrants from Lithuania | 100.0 /100 | #39 | Exceptional 11.2% |
| Mongolians | 100.0 /100 | #40 | Exceptional 11.2% |
| Paraguayans | 100.0 /100 | #41 | Exceptional 11.2% |
| Israelis | 100.0 /100 | #42 | Exceptional 11.2% |
| Afghans | 100.0 /100 | #43 | Exceptional 11.2% |
| Cambodians | 100.0 /100 | #44 | Exceptional 11.3% |
| Immigrants from Sweden | 100.0 /100 | #45 | Exceptional 11.3% |
| Immigrants from Nepal | 100.0 /100 | #46 | Exceptional 11.3% |
| Jordanians | 100.0 /100 | #47 | Exceptional 11.3% |
| Zimbabweans | 100.0 /100 | #48 | Exceptional 11.3% |
| Tongans | 100.0 /100 | #49 | Exceptional 11.3% |
| Inupiat | 100.0 /100 | #50 | Exceptional 11.3% |
| Immigrants from Belgium | 100.0 /100 | #51 | Exceptional 11.3% |
Cambodian Female Disability Correlation Summary
| Measurement | Cambodian Data | Female Disability Data |
| Minimum | 0.024% | 6.5% |
| Maximum | 17.6% | 35.1% |
| Range | 17.6% | 28.6% |
| Mean | 2.7% | 14.5% |
| Median | 1.7% | 11.2% |
| Interquartile 25% (IQ1) | 0.83% | 9.9% |
| Interquartile 75% (IQ3) | 3.4% | 15.1% |
| Interquartile Range (IQR) | 2.5% | 5.2% |
| Standard Deviation (Sample) | 3.2% | 7.7% |
| Standard Deviation (Population) | 3.2% | 7.6% |
Correlation Details
| Cambodian Percentile | Sample Size | Female Disability |
[ 0.0% - 0.5% ] 0.024% | 87,232,577 | 12.1% |
[ 0.0% - 0.5% ] 0.12% | 8,309,807 | 10.9% |
[ 0.0% - 0.5% ] 0.22% | 2,497,760 | 10.3% |
[ 0.0% - 0.5% ] 0.30% | 1,482,350 | 11.5% |
[ 0.0% - 0.5% ] 0.38% | 713,106 | 10.7% |
[ 0.0% - 0.5% ] 0.48% | 385,886 | 10.8% |
[ 0.5% - 1.0% ] 0.59% | 413,726 | 8.1% |
[ 0.5% - 1.0% ] 0.65% | 411,385 | 12.1% |
[ 0.5% - 1.0% ] 0.74% | 356,632 | 11.0% |
[ 0.5% - 1.0% ] 0.83% | 201,106 | 10.2% |
[ 0.5% - 1.0% ] 0.90% | 94,130 | 10.6% |
[ 1.0% - 1.5% ] 1.01% | 140,025 | 9.9% |
[ 1.0% - 1.5% ] 1.07% | 53,882 | 12.1% |
[ 1.0% - 1.5% ] 1.18% | 23,929 | 8.9% |
[ 1.0% - 1.5% ] 1.26% | 43,843 | 8.9% |
[ 1.0% - 1.5% ] 1.36% | 8,899 | 13.6% |
[ 1.0% - 1.5% ] 1.48% | 1,692 | 6.9% |
[ 1.5% - 2.0% ] 1.54% | 845 | 12.4% |
[ 1.5% - 2.0% ] 1.64% | 6,771 | 8.0% |
[ 1.5% - 2.0% ] 1.68% | 475 | 14.9% |
[ 1.5% - 2.0% ] 1.93% | 1,708 | 7.8% |
[ 1.5% - 2.0% ] 1.99% | 2,367 | 26.0% |
[ 2.0% - 2.5% ] 2.23% | 38,400 | 9.3% |
[ 2.0% - 2.5% ] 2.30% | 25,374 | 9.3% |
[ 2.5% - 3.0% ] 2.51% | 41,058 | 10.5% |
[ 2.5% - 3.0% ] 2.65% | 2,716 | 17.3% |
[ 2.5% - 3.0% ] 2.86% | 3,571 | 25.7% |
[ 3.0% - 3.5% ] 3.10% | 2,933 | 9.9% |
[ 3.0% - 3.5% ] 3.35% | 1,670 | 34.4% |
[ 3.5% - 4.0% ] 3.65% | 2,028 | 14.2% |
[ 3.5% - 4.0% ] 3.71% | 674 | 15.1% |
[ 3.5% - 4.0% ] 3.95% | 1,822 | 6.5% |
[ 4.5% - 5.0% ] 4.90% | 102 | 25.9% |
[ 5.0% - 5.5% ] 5.28% | 587 | 28.9% |
[ 6.0% - 6.5% ] 6.37% | 581 | 24.6% |
[ 7.0% - 7.5% ] 7.09% | 1,411 | 25.0% |
[ 8.5% - 9.0% ] 8.66% | 831 | 35.1% |
[ 17.5% - 18.0% ] 17.57% | 569 | 13.5% |