Cambodian Self-Care Disability
COMPARE
Cambodian
Select to Compare
Self-Care Disability
Cambodian Self-Care Disability
2.2%
SELF-CARE DISABILITY
100.0/ 100
METRIC RATING
23rd/ 347
METRIC RANK
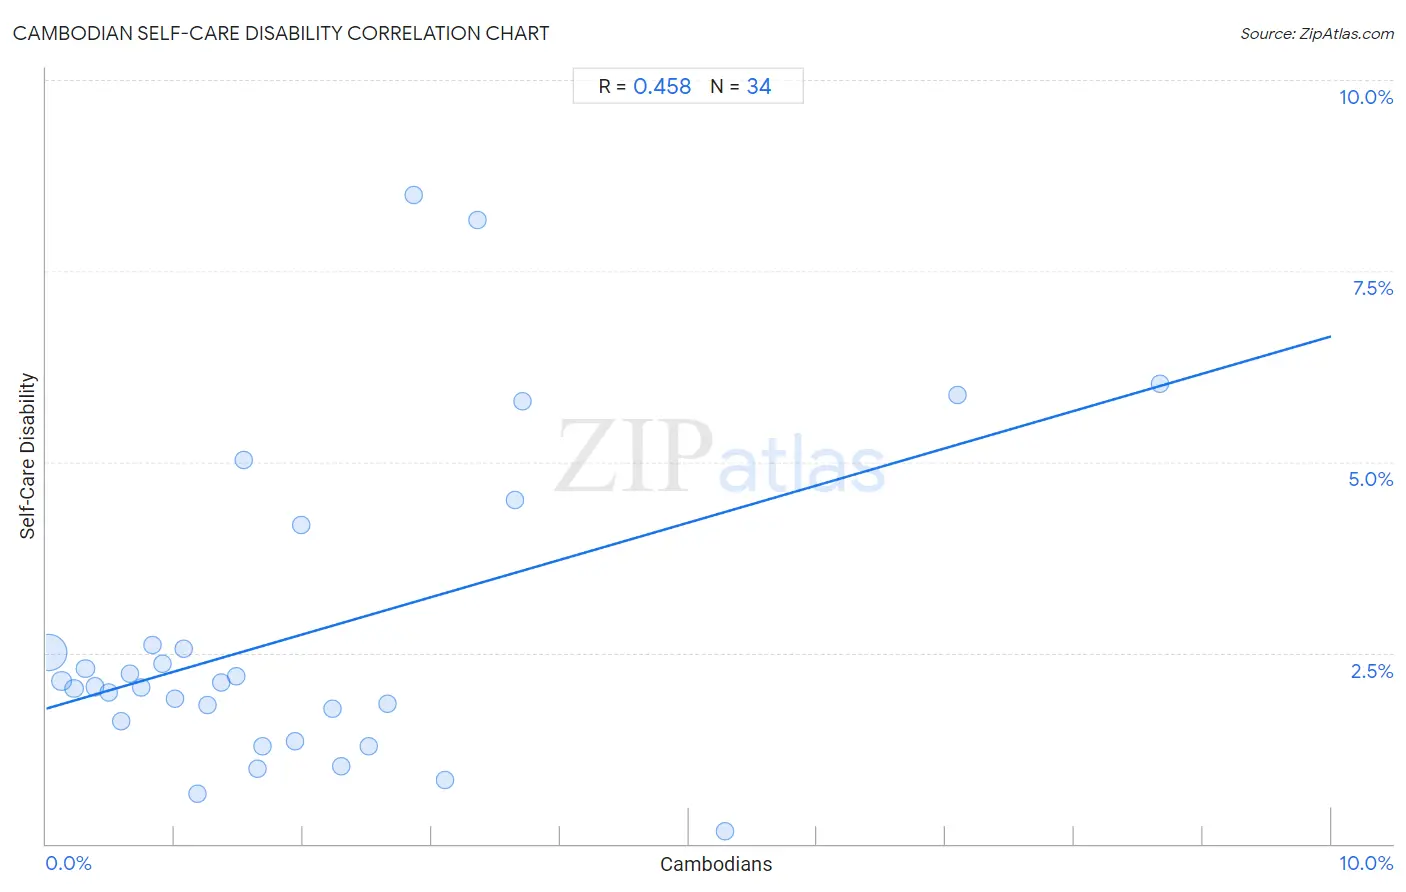
Cambodian Self-Care Disability Correlation Chart
The statistical analysis conducted on geographies consisting of 102,460,222 people shows a moderate positive correlation between the proportion of Cambodians and percentage of population with self-care disability in the United States with a correlation coefficient (R) of 0.458 and weighted average of 2.2%. On average, for every 1% (one percent) increase in Cambodians within a typical geography, there is an increase of 0.49% in percentage of population with self-care disability.
It is essential to understand that the correlation between the percentage of Cambodians and percentage of population with self-care disability does not imply a direct cause-and-effect relationship. It remains uncertain whether the presence of Cambodians influences an upward or downward trend in the level of percentage of population with self-care disability within an area, or if Cambodians simply ended up residing in those areas with higher or lower levels of percentage of population with self-care disability due to other factors.
Demographics Similar to Cambodians by Self-Care Disability
In terms of self-care disability, the demographic groups most similar to Cambodians are Immigrants from Venezuela (2.2%, a difference of 0.21%), Bulgarian (2.2%, a difference of 0.25%), Cypriot (2.2%, a difference of 0.30%), Turkish (2.2%, a difference of 0.41%), and Immigrants from Sri Lanka (2.2%, a difference of 0.48%).
| Demographics | Rating | Rank | Self-Care Disability |
| Immigrants from Kuwait | 100.0 /100 | #16 | Exceptional 2.2% |
| Immigrants from Saudi Arabia | 100.0 /100 | #17 | Exceptional 2.2% |
| Immigrants from Taiwan | 100.0 /100 | #18 | Exceptional 2.2% |
| Immigrants from Eritrea | 100.0 /100 | #19 | Exceptional 2.2% |
| Tongans | 100.0 /100 | #20 | Exceptional 2.2% |
| Bulgarians | 100.0 /100 | #21 | Exceptional 2.2% |
| Immigrants from Venezuela | 100.0 /100 | #22 | Exceptional 2.2% |
| Cambodians | 100.0 /100 | #23 | Exceptional 2.2% |
| Cypriots | 100.0 /100 | #24 | Exceptional 2.2% |
| Turks | 100.0 /100 | #25 | Exceptional 2.2% |
| Immigrants from Sri Lanka | 99.9 /100 | #26 | Exceptional 2.2% |
| Venezuelans | 99.9 /100 | #27 | Exceptional 2.2% |
| Inupiat | 99.9 /100 | #28 | Exceptional 2.2% |
| Immigrants from Zimbabwe | 99.9 /100 | #29 | Exceptional 2.3% |
| Paraguayans | 99.9 /100 | #30 | Exceptional 2.3% |
Cambodian Self-Care Disability Correlation Summary
| Measurement | Cambodian Data | Self-Care Disability Data |
| Minimum | 0.024% | 0.17% |
| Maximum | 8.7% | 8.5% |
| Range | 8.6% | 8.3% |
| Mean | 2.0% | 2.8% |
| Median | 1.5% | 2.1% |
| Interquartile 25% (IQ1) | 0.74% | 1.6% |
| Interquartile 75% (IQ3) | 2.7% | 2.6% |
| Interquartile Range (IQR) | 1.9% | 1.00% |
| Standard Deviation (Sample) | 1.9% | 2.0% |
| Standard Deviation (Population) | 1.9% | 2.0% |
Correlation Details
| Cambodian Percentile | Sample Size | Self-Care Disability |
[ 0.0% - 0.5% ] 0.024% | 87,224,643 | 2.5% |
[ 0.0% - 0.5% ] 0.12% | 8,292,313 | 2.1% |
[ 0.0% - 0.5% ] 0.22% | 2,493,887 | 2.0% |
[ 0.0% - 0.5% ] 0.30% | 1,482,350 | 2.3% |
[ 0.0% - 0.5% ] 0.38% | 707,065 | 2.1% |
[ 0.0% - 0.5% ] 0.48% | 385,886 | 2.0% |
[ 0.5% - 1.0% ] 0.59% | 406,132 | 1.6% |
[ 0.5% - 1.0% ] 0.65% | 411,385 | 2.2% |
[ 0.5% - 1.0% ] 0.74% | 356,103 | 2.1% |
[ 0.5% - 1.0% ] 0.83% | 201,106 | 2.6% |
[ 0.5% - 1.0% ] 0.90% | 94,130 | 2.4% |
[ 1.0% - 1.5% ] 1.01% | 140,025 | 1.9% |
[ 1.0% - 1.5% ] 1.07% | 53,882 | 2.6% |
[ 1.0% - 1.5% ] 1.18% | 23,929 | 0.66% |
[ 1.0% - 1.5% ] 1.26% | 43,376 | 1.8% |
[ 1.0% - 1.5% ] 1.36% | 8,899 | 2.1% |
[ 1.0% - 1.5% ] 1.48% | 1,692 | 2.2% |
[ 1.5% - 2.0% ] 1.54% | 845 | 5.0% |
[ 1.5% - 2.0% ] 1.64% | 6,771 | 0.98% |
[ 1.5% - 2.0% ] 1.68% | 475 | 1.3% |
[ 1.5% - 2.0% ] 1.93% | 1,708 | 1.3% |
[ 1.5% - 2.0% ] 1.99% | 2,367 | 4.2% |
[ 2.0% - 2.5% ] 2.23% | 38,400 | 1.8% |
[ 2.0% - 2.5% ] 2.30% | 25,374 | 1.0% |
[ 2.5% - 3.0% ] 2.51% | 41,058 | 1.3% |
[ 2.5% - 3.0% ] 2.65% | 2,716 | 1.8% |
[ 2.5% - 3.0% ] 2.86% | 3,571 | 8.5% |
[ 3.0% - 3.5% ] 3.10% | 2,933 | 0.83% |
[ 3.0% - 3.5% ] 3.35% | 1,670 | 8.2% |
[ 3.5% - 4.0% ] 3.65% | 2,028 | 4.5% |
[ 3.5% - 4.0% ] 3.71% | 674 | 5.8% |
[ 5.0% - 5.5% ] 5.28% | 587 | 0.17% |
[ 7.0% - 7.5% ] 7.09% | 1,411 | 5.9% |
[ 8.5% - 9.0% ] 8.66% | 831 | 6.0% |