Cambodian Married-couple Households
COMPARE
Cambodian
Select to Compare
Married-couple Households
Cambodian Married-couple Households
45.9%
MARRIED-COUPLE HOUSEHOLDS
21.3/ 100
METRIC RATING
197th/ 347
METRIC RANK
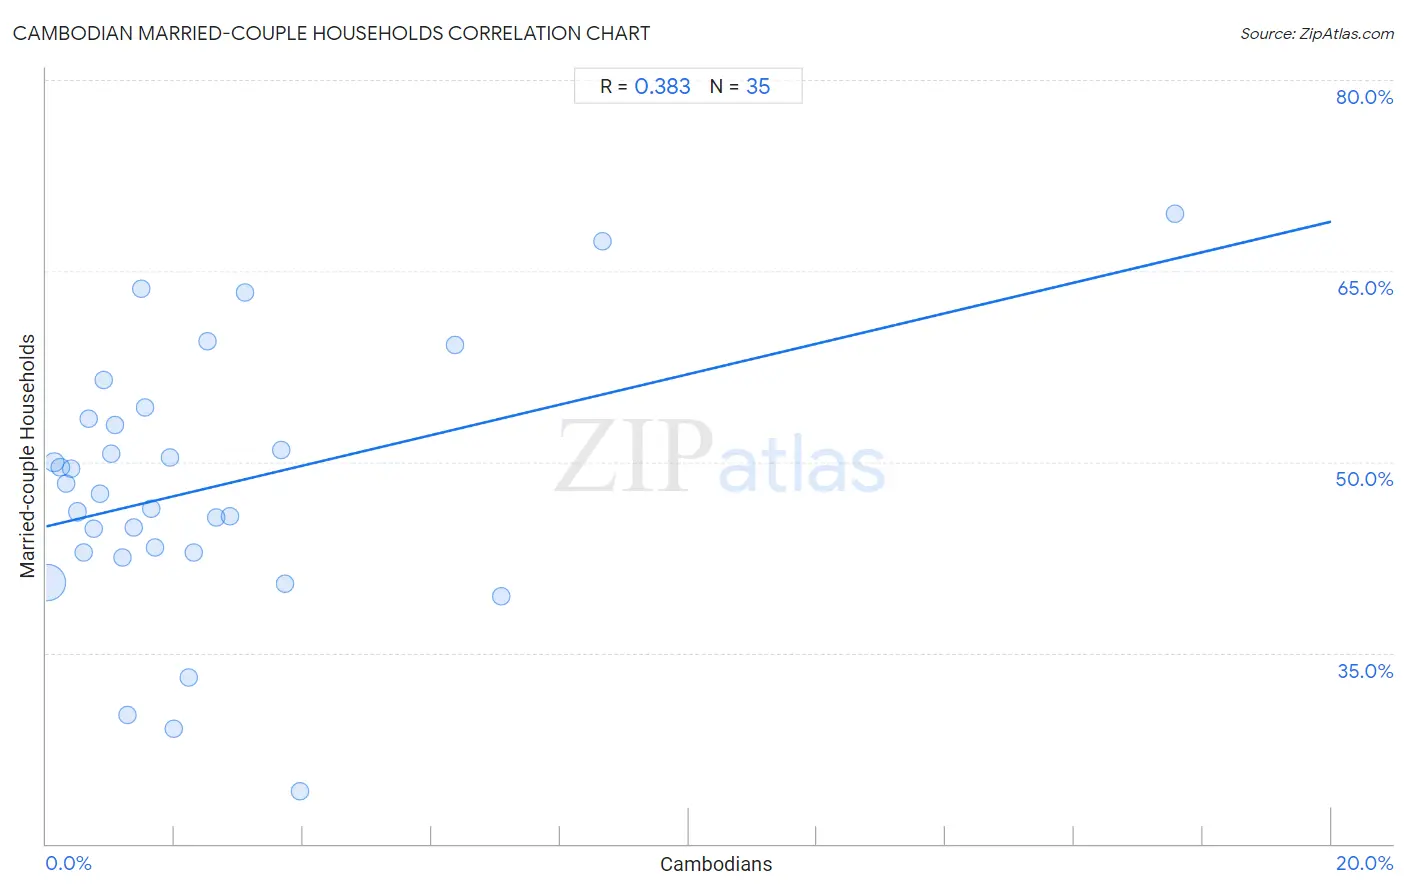
Cambodian Married-couple Households Correlation Chart
The statistical analysis conducted on geographies consisting of 102,469,130 people shows a mild positive correlation between the proportion of Cambodians and percentage of married-couple family households in the United States with a correlation coefficient (R) of 0.383 and weighted average of 45.9%. On average, for every 1% (one percent) increase in Cambodians within a typical geography, there is an increase of 1.2% in percentage of married-couple family households.
It is essential to understand that the correlation between the percentage of Cambodians and percentage of married-couple family households does not imply a direct cause-and-effect relationship. It remains uncertain whether the presence of Cambodians influences an upward or downward trend in the level of percentage of married-couple family households within an area, or if Cambodians simply ended up residing in those areas with higher or lower levels of percentage of married-couple family households due to other factors.
Demographics Similar to Cambodians by Married-couple Households
In terms of married-couple households, the demographic groups most similar to Cambodians are Immigrants from South America (45.9%, a difference of 0.050%), Chickasaw (45.9%, a difference of 0.080%), Mexican American Indian (45.9%, a difference of 0.11%), Ottawa (45.8%, a difference of 0.11%), and Taiwanese (45.9%, a difference of 0.12%).
| Demographics | Rating | Rank | Married-couple Households |
| Immigrants from Kuwait | 25.6 /100 | #190 | Fair 46.0% |
| Choctaw | 24.9 /100 | #191 | Fair 46.0% |
| Immigrants from Northern Africa | 24.6 /100 | #192 | Fair 46.0% |
| Taiwanese | 23.4 /100 | #193 | Fair 45.9% |
| Mexican American Indians | 23.3 /100 | #194 | Fair 45.9% |
| Chickasaw | 22.7 /100 | #195 | Fair 45.9% |
| Immigrants from South America | 22.2 /100 | #196 | Fair 45.9% |
| Cambodians | 21.3 /100 | #197 | Fair 45.9% |
| Ottawa | 19.4 /100 | #198 | Poor 45.8% |
| Carpatho Rusyns | 15.7 /100 | #199 | Poor 45.7% |
| Potawatomi | 15.6 /100 | #200 | Poor 45.7% |
| Immigrants from Serbia | 15.2 /100 | #201 | Poor 45.7% |
| Immigrants from Central America | 14.2 /100 | #202 | Poor 45.7% |
| Alaska Natives | 13.0 /100 | #203 | Poor 45.6% |
| Aleuts | 12.5 /100 | #204 | Poor 45.6% |
Cambodian Married-couple Households Correlation Summary
| Measurement | Cambodian Data | Married-couple Households Data |
| Minimum | 0.024% | 24.1% |
| Maximum | 17.6% | 69.5% |
| Range | 17.6% | 45.4% |
| Mean | 2.5% | 47.9% |
| Median | 1.5% | 47.5% |
| Interquartile 25% (IQ1) | 0.74% | 42.9% |
| Interquartile 75% (IQ3) | 2.9% | 53.4% |
| Interquartile Range (IQR) | 2.1% | 10.5% |
| Standard Deviation (Sample) | 3.3% | 10.2% |
| Standard Deviation (Population) | 3.2% | 10.1% |
Correlation Details
| Cambodian Percentile | Sample Size | Married-couple Households |
[ 0.0% - 0.5% ] 0.024% | 87,227,384 | 40.5% |
[ 0.0% - 0.5% ] 0.12% | 8,291,287 | 49.9% |
[ 0.0% - 0.5% ] 0.22% | 2,492,242 | 49.6% |
[ 0.0% - 0.5% ] 0.30% | 1,482,350 | 48.3% |
[ 0.0% - 0.5% ] 0.38% | 707,065 | 49.5% |
[ 0.0% - 0.5% ] 0.48% | 385,886 | 46.1% |
[ 0.5% - 1.0% ] 0.59% | 413,726 | 42.9% |
[ 0.5% - 1.0% ] 0.65% | 411,385 | 53.4% |
[ 0.5% - 1.0% ] 0.74% | 356,632 | 44.7% |
[ 0.5% - 1.0% ] 0.83% | 201,106 | 47.5% |
[ 0.5% - 1.0% ] 0.90% | 94,130 | 56.4% |
[ 1.0% - 1.5% ] 1.01% | 140,025 | 50.7% |
[ 1.0% - 1.5% ] 1.07% | 53,882 | 52.9% |
[ 1.0% - 1.5% ] 1.18% | 23,929 | 42.5% |
[ 1.0% - 1.5% ] 1.26% | 43,376 | 30.1% |
[ 1.0% - 1.5% ] 1.36% | 8,899 | 44.9% |
[ 1.0% - 1.5% ] 1.48% | 1,692 | 63.6% |
[ 1.5% - 2.0% ] 1.54% | 845 | 54.3% |
[ 1.5% - 2.0% ] 1.64% | 6,771 | 46.3% |
[ 1.5% - 2.0% ] 1.68% | 475 | 43.3% |
[ 1.5% - 2.0% ] 1.93% | 1,708 | 50.3% |
[ 1.5% - 2.0% ] 1.99% | 2,367 | 29.0% |
[ 2.0% - 2.5% ] 2.23% | 38,400 | 33.0% |
[ 2.0% - 2.5% ] 2.30% | 25,374 | 42.9% |
[ 2.5% - 3.0% ] 2.51% | 41,058 | 59.5% |
[ 2.5% - 3.0% ] 2.65% | 2,716 | 45.6% |
[ 2.5% - 3.0% ] 2.86% | 3,571 | 45.8% |
[ 3.0% - 3.5% ] 3.10% | 2,933 | 63.3% |
[ 3.5% - 4.0% ] 3.65% | 2,028 | 50.9% |
[ 3.5% - 4.0% ] 3.71% | 674 | 40.4% |
[ 3.5% - 4.0% ] 3.95% | 1,822 | 24.1% |
[ 6.0% - 6.5% ] 6.37% | 581 | 59.2% |
[ 7.0% - 7.5% ] 7.09% | 1,411 | 39.4% |
[ 8.5% - 9.0% ] 8.66% | 831 | 67.4% |
[ 17.5% - 18.0% ] 17.57% | 569 | 69.5% |