Cambodian 2 or more Vehicles in Household

COMPARE

Cambodian
Race
Ancestry
AfghanAfricanAlaska NativeAlaskan AthabascanAlbanianAleutAlsatianAmericanApacheArabArapahoArgentineanArmenianAssyrian/Chaldean/SyriacAustralianAustrianBahamianBangladeshiBarbadianBasqueBelgianBelizeanBermudanBhutaneseBlackfeetBolivianBrazilianBritishBritish West IndianBulgarianBurmeseCajunCambodianCanadianCape VerdeanCarpatho RusynCelticCentral AmericanCentral American IndianCherokeeCheyenneChickasawChileanChineseChippewaChoctawColombianColvilleComancheCosta RicanCreeCreekCroatianCrowCubanCypriotCzechCzechoslovakianDanishDelawareDominicanDutchDutch West IndianEastern EuropeanEcuadorianEgyptianEnglishEstonianEthiopianEuropeanFijianFilipinoFinnishFrenchFrench American IndianFrench CanadianGermanGerman RussianGhanaianGreekGuamanian/ChamorroGuatemalanGuyaneseHaitianHmongHonduranHopiHoumaHungarianIcelanderIndian (Asian)IndonesianInupiatIranianIraqiIrishIroquoisIsraeliItalianJamaicanJapaneseJordanianKenyanKiowaKoreanLaotianLatvianLebaneseLiberianLithuanianLumbeeLuxembourgerMacedonianMalaysianMalteseMarshalleseMenomineeMexicanMexican American IndianMongolianMoroccanNative HawaiianNavajoNepaleseNew ZealanderNicaraguanNigerianNorthern EuropeanNorwegianOkinawanOsageOttawaPaiutePakistaniPalestinianPanamanianParaguayanPennsylvania GermanPeruvianPimaPolishPortuguesePotawatomiPuebloPuerto RicanPuget Sound SalishRomanianRussianSalvadoranSamoanScandinavianScotch-IrishScottishSeminoleSenegaleseSerbianShoshoneSierra LeoneanSiouxSlavicSlovakSloveneSomaliSouth AfricanSouth AmericanSouth American IndianSoviet UnionSpaniardSpanishSpanish AmericanSpanish American IndianSri LankanSubsaharan AfricanSudaneseSwedishSwissSyrianTaiwaneseThaiTlingit-HaidaTohono O'OdhamTonganTrinidadian and TobagonianTsimshianTurkishU.S. Virgin IslanderUgandanUkrainianUruguayanUteVenezuelanVietnameseWelshWest IndianYakamaYaquiYugoslavianYumanYup'ikZimbabwean
Immigration
NonimmigrantsImmigrantsAfghanistanAfricaAlbaniaArgentinaArmeniaAsiaAustraliaAustriaBahamasBangladeshBarbadosBelarusBelgiumBelizeBoliviaBosnia and HerzegovinaBrazilBulgariaBurma/MyanmarCabo VerdeCambodiaCameroonCanadaCaribbeanCentral AmericaChileChinaColombiaCongoCosta RicaCroatiaCubaCzechoslovakiaDenmarkDominicaDominican RepublicEastern AfricaEastern AsiaEastern EuropeEcuadorEgyptEl SalvadorEnglandEritreaEthiopiaEuropeFijiFranceGermanyGhanaGreeceGrenadaGuatemalaGuyanaHaitiHondurasHong KongHungaryIndiaIndonesiaIranIraqIrelandIsraelItalyJamaicaJapanJordanKazakhstanKenyaKoreaKuwaitLaosLatin AmericaLatviaLebanonLiberiaLithuaniaMalaysiaMexicoMicronesiaMiddle AfricaMoldovaMoroccoNepalNetherlandsNicaraguaNigeriaNorth AmericaNorth MacedoniaNorthern AfricaNorthern EuropeNorwayOceaniaPakistanPanamaPeruPhilippinesPolandPortugalRomaniaRussiaSaudi ArabiaScotlandSenegalSerbiaSierra LeoneSingaporeSomaliaSouth AfricaSouth AmericaSouth Central AsiaSouth Eastern AsiaSouthern EuropeSpainSri LankaSt. Vincent and the GrenadinesSudanSwedenSwitzerlandSyriaTaiwanThailandTrinidad and TobagoTurkeyUgandaUkraineUruguayUzbekistanVenezuelaVietnamWest IndiesWestern AfricaWestern AsiaWestern EuropeYemenZaireZimbabweAzores
Select to Compare
Race
Ancestry
AfghanAfricanAlaska NativeAlaskan AthabascanAlbanianAleutAlsatianAmericanApacheArabArapahoArgentineanArmenianAssyrian/Chaldean/SyriacAustralianAustrianBahamianBangladeshiBarbadianBasqueBelgianBelizeanBermudanBhutaneseBlackfeetBolivianBrazilianBritishBritish West IndianBulgarianBurmeseCajunCanadianCape VerdeanCarpatho RusynCelticCentral AmericanCentral American IndianCherokeeCheyenneChickasawChileanChineseChippewaChoctawColombianColvilleComancheCosta RicanCreeCreekCroatianCrowCubanCypriotCzechCzechoslovakianDanishDelawareDominicanDutchDutch West IndianEastern EuropeanEcuadorianEgyptianEnglishEstonianEthiopianEuropeanFijianFilipinoFinnishFrenchFrench American IndianFrench CanadianGermanGerman RussianGhanaianGreekGuamanian/ChamorroGuatemalanGuyaneseHaitianHmongHonduranHopiHoumaHungarianIcelanderIndian (Asian)IndonesianInupiatIranianIraqiIrishIroquoisIsraeliItalianJamaicanJapaneseJordanianKenyanKiowaKoreanLaotianLatvianLebaneseLiberianLithuanianLumbeeLuxembourgerMacedonianMalaysianMalteseMarshalleseMenomineeMexicanMexican American IndianMongolianMoroccanNative HawaiianNavajoNepaleseNew ZealanderNicaraguanNigerianNorthern EuropeanNorwegianOkinawanOsageOttawaPaiutePakistaniPalestinianPanamanianParaguayanPennsylvania GermanPeruvianPimaPolishPortuguesePotawatomiPuebloPuerto RicanPuget Sound SalishRomanianRussianSalvadoranSamoanScandinavianScotch-IrishScottishSeminoleSenegaleseSerbianShoshoneSierra LeoneanSiouxSlavicSlovakSloveneSomaliSouth AfricanSouth AmericanSouth American IndianSoviet UnionSpaniardSpanishSpanish AmericanSpanish American IndianSri LankanSubsaharan AfricanSudaneseSwedishSwissSyrianTaiwaneseThaiTlingit-HaidaTohono O'OdhamTonganTrinidadian and TobagonianTsimshianTurkishU.S. Virgin IslanderUgandanUkrainianUruguayanUteVenezuelanVietnameseWelshWest IndianYakamaYaquiYugoslavianYumanYup'ikZimbabwean
Immigration
NonimmigrantsImmigrantsAfghanistanAfricaAlbaniaArgentinaArmeniaAsiaAustraliaAustriaBahamasBangladeshBarbadosBelarusBelgiumBelizeBoliviaBosnia and HerzegovinaBrazilBulgariaBurma/MyanmarCabo VerdeCambodiaCameroonCanadaCaribbeanCentral AmericaChileChinaColombiaCongoCosta RicaCroatiaCubaCzechoslovakiaDenmarkDominicaDominican RepublicEastern AfricaEastern AsiaEastern EuropeEcuadorEgyptEl SalvadorEnglandEritreaEthiopiaEuropeFijiFranceGermanyGhanaGreeceGrenadaGuatemalaGuyanaHaitiHondurasHong KongHungaryIndiaIndonesiaIranIraqIrelandIsraelItalyJamaicaJapanJordanKazakhstanKenyaKoreaKuwaitLaosLatin AmericaLatviaLebanonLiberiaLithuaniaMalaysiaMexicoMicronesiaMiddle AfricaMoldovaMoroccoNepalNetherlandsNicaraguaNigeriaNorth AmericaNorth MacedoniaNorthern AfricaNorthern EuropeNorwayOceaniaPakistanPanamaPeruPhilippinesPolandPortugalRomaniaRussiaSaudi ArabiaScotlandSenegalSerbiaSierra LeoneSingaporeSomaliaSouth AfricaSouth AmericaSouth Central AsiaSouth Eastern AsiaSouthern EuropeSpainSri LankaSt. Vincent and the GrenadinesSudanSwedenSwitzerlandSyriaTaiwanThailandTrinidad and TobagoTurkeyUgandaUkraineUruguayUzbekistanVenezuelaVietnamWest IndiesWestern AfricaWestern AsiaWestern EuropeYemenZaireZimbabweAzores
2 or more Vehicles in Household
Income
Poverty
Unemployment
Labor Participation
Family Structure
Vehicle Availability
Education Level
Disability

Cambodian 2 or more Vehicles in Household
Tragic

53.3%
2+ VEHICLES AVAILABLE
2.3/ 100
METRIC RATING
239th/ 347
METRIC RANK

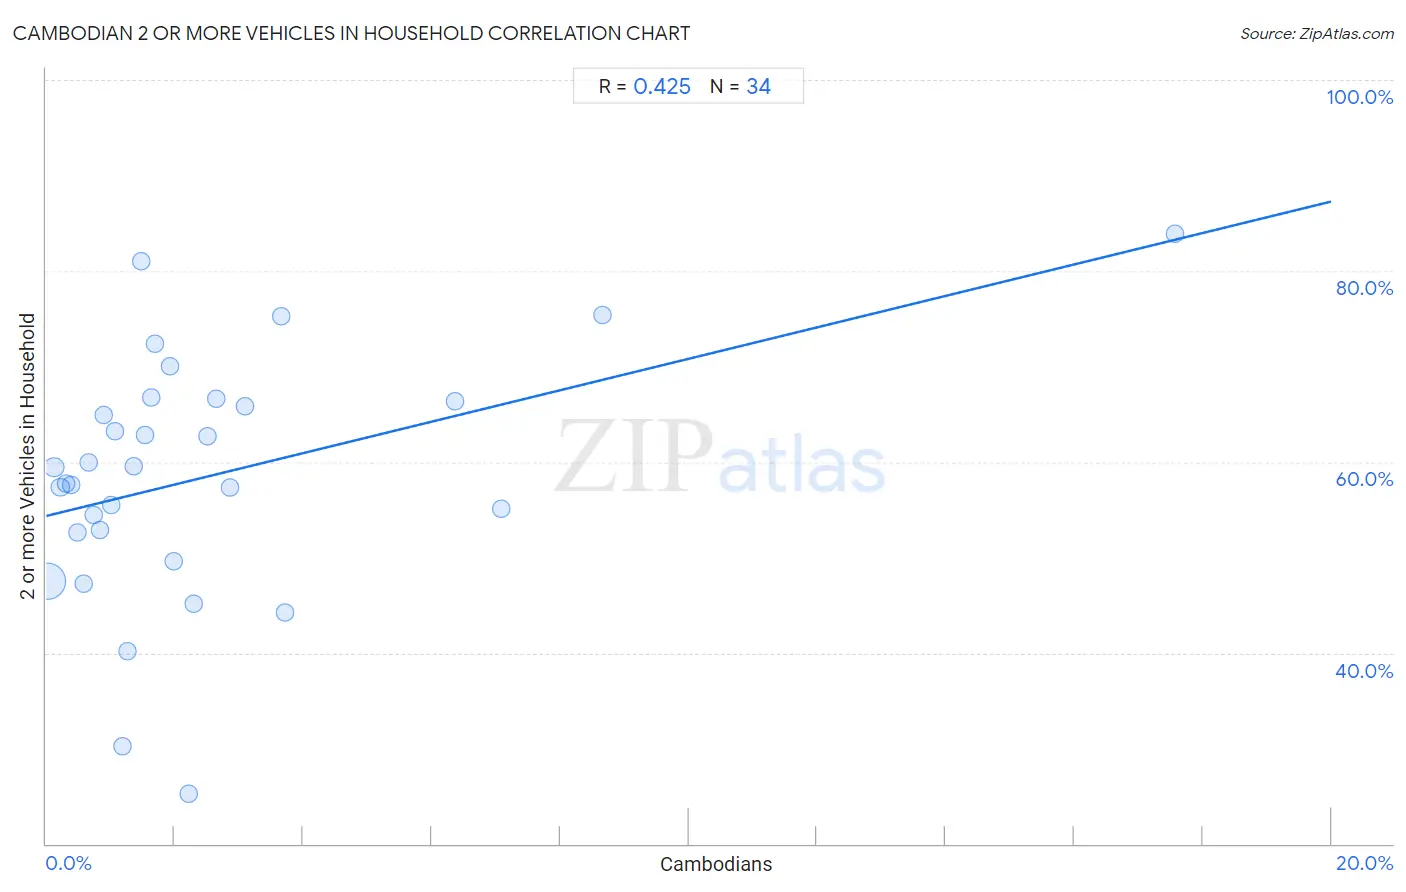
Cambodian 2 or more Vehicles in Household Correlation Chart

The statistical analysis conducted on geographies consisting of 102,491,174 people shows a moderate positive correlation between the proportion of Cambodians and percentage of households with 2 or more vehicles available in the United States with a correlation coefficient (R) of 0.425 and weighted average of 53.3%. On average, for every 1% (one percent) increase in Cambodians within a typical geography, there is an increase of 1.6% in percentage of households with 2 or more vehicles available.
Cambodian 2 or more Vehicles in Household
It is essential to understand that the correlation between the percentage of Cambodians and percentage of households with 2 or more vehicles available does not imply a direct cause-and-effect relationship. It remains uncertain whether the presence of Cambodians influences an upward or downward trend in the level of percentage of households with 2 or more vehicles available within an area, or if Cambodians simply ended up residing in those areas with higher or lower levels of percentage of households with 2 or more vehicles available due to other factors.

Demographics Similar to Cambodians by 2 or more Vehicles in Household

In terms of 2 or more vehicles in household, the demographic groups most similar to Cambodians are Immigrants from Armenia (53.3%, a difference of 0.010%), Macedonian (53.3%, a difference of 0.070%), Immigrants from Europe (53.2%, a difference of 0.070%), Immigrants from Sierra Leone (53.2%, a difference of 0.10%), and Immigrants from Eastern Asia (53.2%, a difference of 0.10%).
DemographicsRating | Rank2 or more Vehicles in Household
Immigrants from Guatemala
3.2
/100
|
#232
Tragic
53.5%
Ugandans
3.2
/100
|
#233
Tragic
53.5%
Immigrants from Switzerland
3.0
/100
|
#234
Tragic
53.4%
Immigrants from Middle Africa
3.0
/100
|
#235
Tragic
53.4%
Indonesians
2.7
/100
|
#236
Tragic
53.4%
Macedonians
2.4
/100
|
#237
Tragic
53.3%
Immigrants from Armenia
2.3
/100
|
#238
Tragic
53.3%
Cambodians
2.3
/100
|
#239
Tragic
53.3%
Immigrants from Europe
2.1
/100
|
#240
Tragic
53.2%
Immigrants from Sierra Leone
2.1
/100
|
#241
Tragic
53.2%
Immigrants from Eastern Asia
2.1
/100
|
#242
Tragic
53.2%
Ethiopians
1.7
/100
|
#243
Tragic
53.1%
Indians (Asian)
1.7
/100
|
#244
Tragic
53.1%
Immigrants from Ethiopia
1.5
/100
|
#245
Tragic
53.0%
Immigrants from Nigeria
1.2
/100
|
#246
Tragic
52.9%

Cambodian 2 or more Vehicles in Household Correlation Summary

MeasurementCambodian Data2 or more Vehicles in Household Data
Minimum0.024%25.3%
Maximum17.6%83.9%
Range17.6%58.6%
Mean2.5%58.4%
Median1.5%58.6%
Interquartile 25% (IQ1)0.74%52.7%
Interquartile 75% (IQ3)2.7%66.4%
Interquartile Range (IQR)1.9%13.8%
Standard Deviation (Sample)3.3%12.9%
Standard Deviation (Population)3.3%12.7%

Correlation Details

Cambodian PercentileSample Size2 or more Vehicles in Household
[
0.0%
-
0.5%
]
0.024%
87,237,34747.5%
[
0.0%
-
0.5%
]
0.12%
8,296,88859.4%
[
0.0%
-
0.5%
]
0.22%
2,495,55957.3%
[
0.0%
-
0.5%
]
0.30%
1,482,35057.7%
[
0.0%
-
0.5%
]
0.38%
712,05057.6%
[
0.0%
-
0.5%
]
0.48%
385,88652.7%
[
0.5%
-
1.0%
]
0.59%
413,72647.2%
[
0.5%
-
1.0%
]
0.65%
411,38559.9%
[
0.5%
-
1.0%
]
0.74%
356,63254.4%
[
0.5%
-
1.0%
]
0.83%
201,10652.9%
[
0.5%
-
1.0%
]
0.90%
94,13064.9%
[
1.0%
-
1.5%
]
1.01%
140,02555.4%
[
1.0%
-
1.5%
]
1.07%
53,88263.1%
[
1.0%
-
1.5%
]
1.18%
23,92930.1%
[
1.0%
-
1.5%
]
1.26%
43,37640.1%
[
1.0%
-
1.5%
]
1.36%
8,89959.6%
[
1.0%
-
1.5%
]
1.48%
1,69281.0%
[
1.5%
-
2.0%
]
1.54%
84562.8%
[
1.5%
-
2.0%
]
1.64%
6,77166.7%
[
1.5%
-
2.0%
]
1.68%
47572.3%
[
1.5%
-
2.0%
]
1.93%
1,70870.1%
[
1.5%
-
2.0%
]
1.99%
2,36749.6%
[
2.0%
-
2.5%
]
2.23%
38,40025.3%
[
2.0%
-
2.5%
]
2.30%
25,37445.2%
[
2.5%
-
3.0%
]
2.51%
41,05862.7%
[
2.5%
-
3.0%
]
2.65%
2,71666.6%
[
2.5%
-
3.0%
]
2.86%
3,57157.3%
[
3.0%
-
3.5%
]
3.10%
2,93365.8%
[
3.5%
-
4.0%
]
3.65%
2,02875.2%
[
3.5%
-
4.0%
]
3.71%
67444.2%
[
6.0%
-
6.5%
]
6.37%
58166.4%
[
7.0%
-
7.5%
]
7.09%
1,41155.1%
[
8.5%
-
9.0%
]
8.66%
83175.4%
[
17.5%
-
18.0%
]
17.57%
56983.9%