British Receiving Food Stamps
COMPARE
British
Select to Compare
Receiving Food Stamps
British Receiving Food Stamps
9.7%
PUBLIC INCOME | FOOD STAMPS
99.2/ 100
METRIC RATING
59th/ 347
METRIC RANK
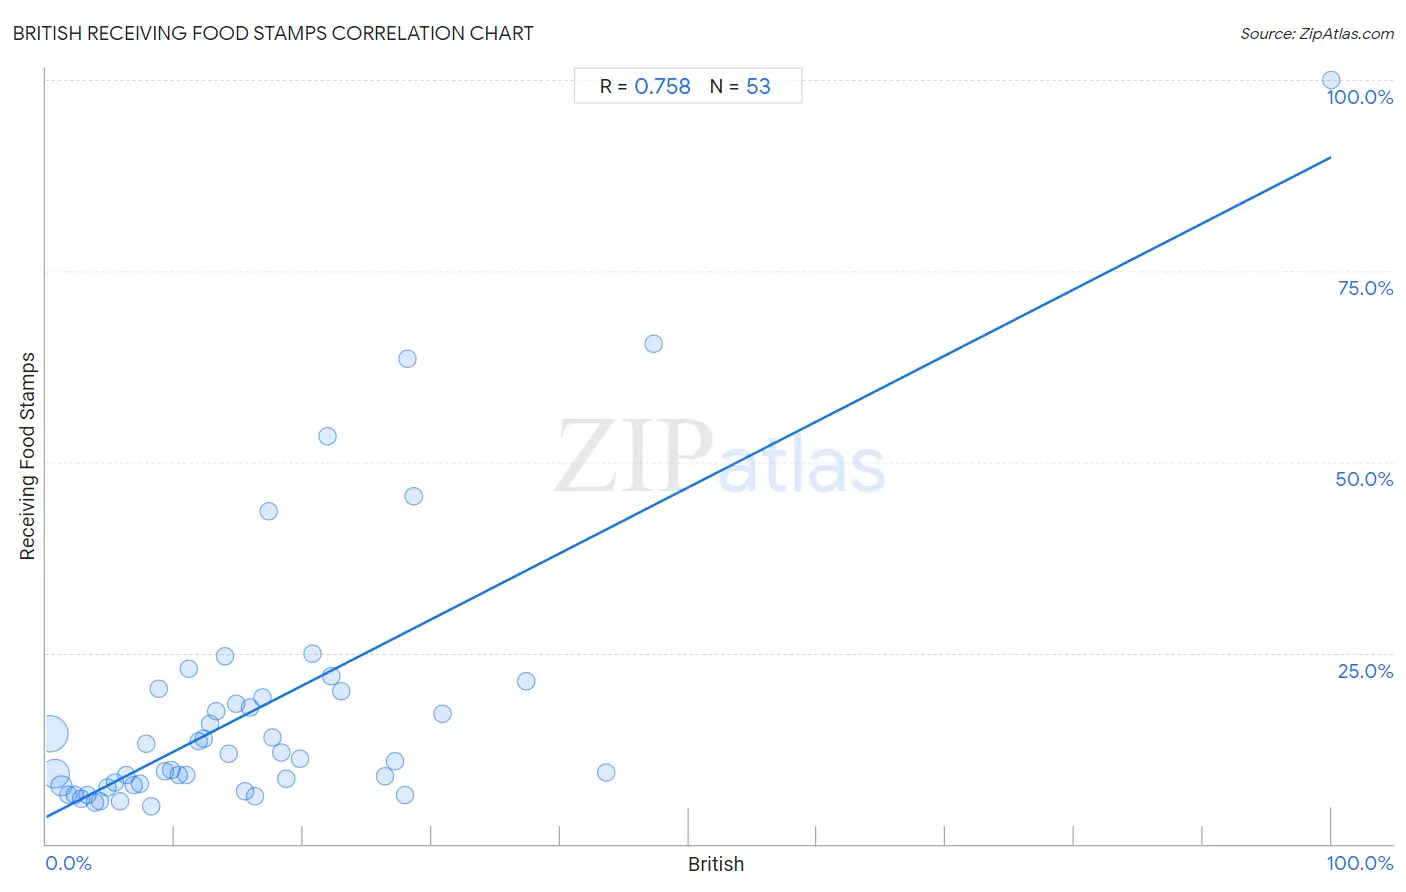
British Receiving Food Stamps Correlation Chart
The statistical analysis conducted on geographies consisting of 528,917,419 people shows a strong positive correlation between the proportion of British and percentage of population receiving government assistance and/or food stamps in the United States with a correlation coefficient (R) of 0.758 and weighted average of 9.7%. On average, for every 1% (one percent) increase in British within a typical geography, there is an increase of 0.86% in percentage of population receiving government assistance and/or food stamps.
It is essential to understand that the correlation between the percentage of British and percentage of population receiving government assistance and/or food stamps does not imply a direct cause-and-effect relationship. It remains uncertain whether the presence of British influences an upward or downward trend in the level of percentage of population receiving government assistance and/or food stamps within an area, or if British simply ended up residing in those areas with higher or lower levels of percentage of population receiving government assistance and/or food stamps due to other factors.
Demographics Similar to British by Receiving Food Stamps
In terms of receiving food stamps, the demographic groups most similar to British are Scandinavian (9.7%, a difference of 0.030%), Greek (9.7%, a difference of 0.090%), German (9.7%, a difference of 0.10%), Immigrants from Canada (9.7%, a difference of 0.20%), and English (9.8%, a difference of 0.24%).
| Demographics | Rating | Rank | Receiving Food Stamps |
| Immigrants from South Africa | 99.3 /100 | #52 | Exceptional 9.7% |
| Tongans | 99.3 /100 | #53 | Exceptional 9.7% |
| Swiss | 99.3 /100 | #54 | Exceptional 9.7% |
| Immigrants from Switzerland | 99.3 /100 | #55 | Exceptional 9.7% |
| Immigrants from Canada | 99.3 /100 | #56 | Exceptional 9.7% |
| Greeks | 99.3 /100 | #57 | Exceptional 9.7% |
| Scandinavians | 99.2 /100 | #58 | Exceptional 9.7% |
| British | 99.2 /100 | #59 | Exceptional 9.7% |
| Germans | 99.2 /100 | #60 | Exceptional 9.7% |
| English | 99.2 /100 | #61 | Exceptional 9.8% |
| Immigrants from Bulgaria | 99.2 /100 | #62 | Exceptional 9.8% |
| Chinese | 99.2 /100 | #63 | Exceptional 9.8% |
| Immigrants from North America | 99.2 /100 | #64 | Exceptional 9.8% |
| Immigrants from Turkey | 99.1 /100 | #65 | Exceptional 9.8% |
| Slovenes | 99.1 /100 | #66 | Exceptional 9.8% |
British Receiving Food Stamps Correlation Summary
| Measurement | British Data | Receiving Food Stamps Data |
| Minimum | 0.26% | 4.9% |
| Maximum | 100.0% | 100.0% |
| Range | 99.7% | 95.1% |
| Mean | 16.3% | 17.6% |
| Median | 13.2% | 11.1% |
| Interquartile 25% (IQ1) | 6.5% | 7.6% |
| Interquartile 75% (IQ3) | 21.3% | 19.6% |
| Interquartile Range (IQR) | 14.8% | 12.0% |
| Standard Deviation (Sample) | 15.8% | 18.1% |
| Standard Deviation (Population) | 15.7% | 17.9% |
Correlation Details
| British Percentile | Sample Size | Receiving Food Stamps |
[ 0.0% - 0.5% ] 0.26% | 284,892,687 | 14.4% |
[ 0.5% - 1.0% ] 0.71% | 171,609,475 | 9.2% |
[ 1.0% - 1.5% ] 1.20% | 49,524,060 | 7.6% |
[ 1.5% - 2.0% ] 1.70% | 13,748,560 | 6.5% |
[ 2.0% - 2.5% ] 2.22% | 4,902,686 | 6.5% |
[ 2.5% - 3.0% ] 2.73% | 2,037,358 | 5.9% |
[ 3.0% - 3.5% ] 3.23% | 748,471 | 6.4% |
[ 3.5% - 4.0% ] 3.75% | 560,431 | 5.4% |
[ 4.0% - 4.5% ] 4.19% | 350,362 | 5.6% |
[ 4.5% - 5.0% ] 4.73% | 138,659 | 7.3% |
[ 5.0% - 5.5% ] 5.30% | 76,746 | 8.0% |
[ 5.5% - 6.0% ] 5.79% | 50,072 | 5.6% |
[ 6.0% - 6.5% ] 6.21% | 49,478 | 9.0% |
[ 6.5% - 7.0% ] 6.77% | 47,763 | 7.6% |
[ 7.0% - 7.5% ] 7.27% | 40,187 | 7.9% |
[ 7.5% - 8.0% ] 7.80% | 25,051 | 13.0% |
[ 8.0% - 8.5% ] 8.19% | 33,869 | 4.9% |
[ 8.5% - 9.0% ] 8.76% | 12,573 | 20.3% |
[ 9.0% - 9.5% ] 9.28% | 10,226 | 9.6% |
[ 9.5% - 10.0% ] 9.71% | 3,819 | 9.7% |
[ 10.0% - 10.5% ] 10.27% | 10,494 | 9.0% |
[ 10.5% - 11.0% ] 10.86% | 7,701 | 9.0% |
[ 11.0% - 11.5% ] 11.08% | 2,734 | 22.9% |
[ 11.5% - 12.0% ] 11.85% | 4,978 | 13.5% |
[ 12.0% - 12.5% ] 12.30% | 2,928 | 13.7% |
[ 12.5% - 13.0% ] 12.73% | 2,490 | 15.7% |
[ 13.0% - 13.5% ] 13.21% | 4,527 | 17.3% |
[ 13.5% - 14.0% ] 13.89% | 432 | 24.6% |
[ 14.0% - 14.5% ] 14.22% | 4,333 | 11.8% |
[ 14.5% - 15.0% ] 14.78% | 467 | 18.4% |
[ 15.0% - 15.5% ] 15.43% | 337 | 6.8% |
[ 15.5% - 16.0% ] 15.84% | 3,271 | 17.9% |
[ 16.0% - 16.5% ] 16.26% | 4,255 | 6.2% |
[ 16.5% - 17.0% ] 16.86% | 439 | 19.2% |
[ 17.0% - 17.5% ] 17.29% | 133 | 43.5% |
[ 17.5% - 18.0% ] 17.65% | 153 | 13.9% |
[ 18.0% - 18.5% ] 18.33% | 884 | 12.0% |
[ 18.5% - 19.0% ] 18.70% | 679 | 8.5% |
[ 19.5% - 20.0% ] 19.70% | 203 | 11.1% |
[ 20.5% - 21.0% ] 20.76% | 342 | 24.9% |
[ 21.5% - 22.0% ] 21.87% | 256 | 53.4% |
[ 22.0% - 22.5% ] 22.22% | 234 | 21.9% |
[ 22.5% - 23.0% ] 22.97% | 209 | 20.0% |
[ 26.0% - 26.5% ] 26.33% | 357 | 8.8% |
[ 27.0% - 27.5% ] 27.16% | 243 | 10.8% |
[ 27.5% - 28.0% ] 27.92% | 745 | 6.4% |
[ 28.0% - 28.5% ] 28.12% | 96 | 63.5% |
[ 28.5% - 29.0% ] 28.57% | 21 | 45.5% |
[ 30.5% - 31.0% ] 30.81% | 185 | 17.1% |
[ 37.0% - 37.5% ] 37.37% | 99 | 21.2% |
[ 43.5% - 44.0% ] 43.55% | 287 | 9.3% |
[ 47.0% - 47.5% ] 47.26% | 347 | 65.4% |
[ 99.5% - 100.0% ] 100.00% | 27 | 100.0% |