British Unemployment Among Women with Children Ages 6 to 17 years
COMPARE
British
Select to Compare
Unemployment Among Women with Children Ages 6 to 17 years
British Unemployment Among Women with Children Ages 6 to 17 years
8.9%
UNEMPLOYMENT | WOMEN W/ CHILDREN 6 TO 17
55.2/ 100
METRIC RATING
169th/ 347
METRIC RANK
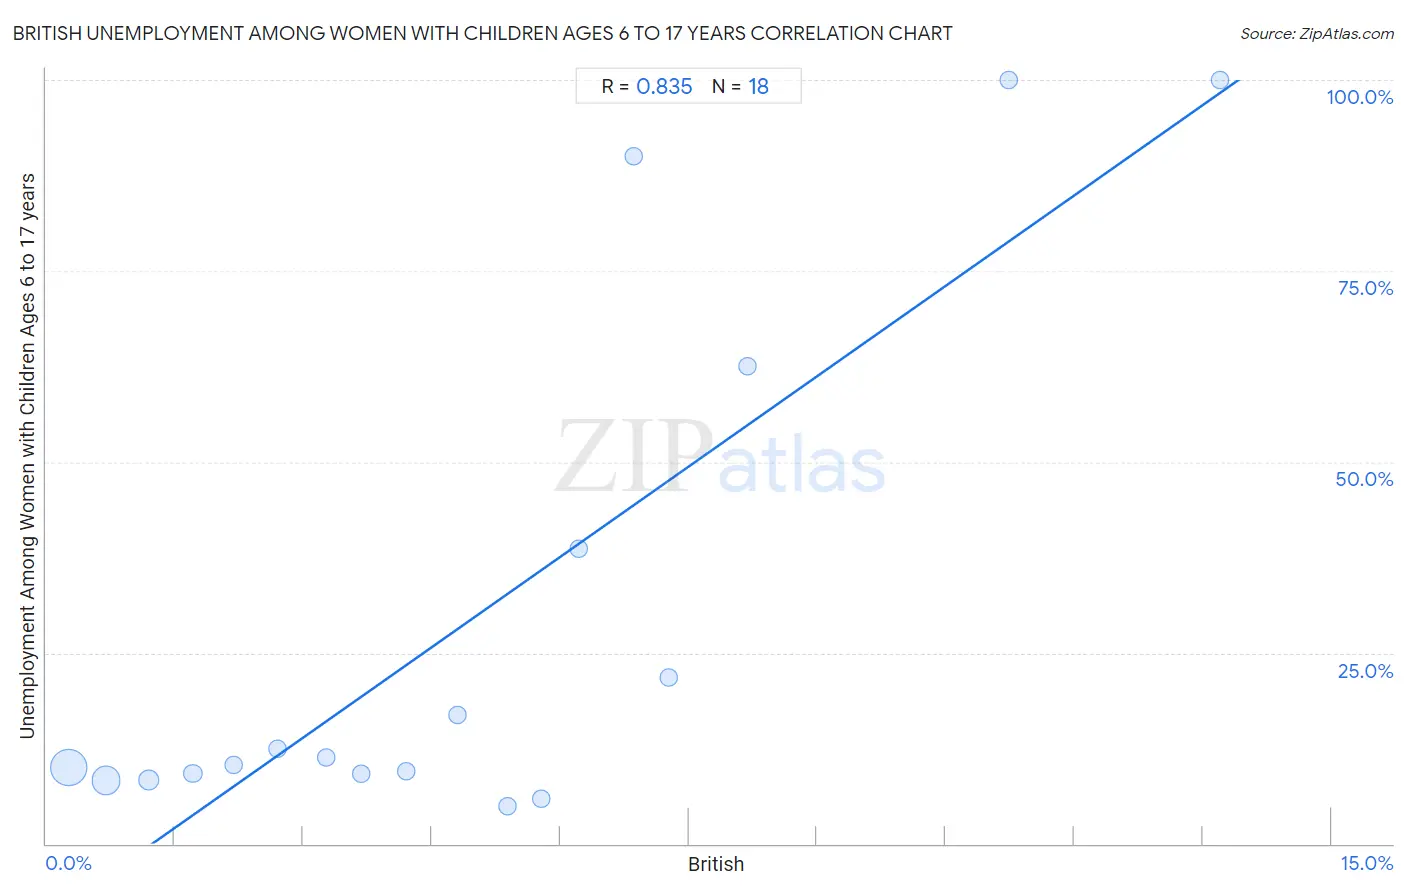
British Unemployment Among Women with Children Ages 6 to 17 years Correlation Chart
The statistical analysis conducted on geographies consisting of 343,173,171 people shows a very strong positive correlation between the proportion of British and unemployment rate among women with children between the ages 6 and 17 in the United States with a correlation coefficient (R) of 0.835 and weighted average of 8.9%. On average, for every 1% (one percent) increase in British within a typical geography, there is an increase of 7.9% in unemployment rate among women with children between the ages 6 and 17.
It is essential to understand that the correlation between the percentage of British and unemployment rate among women with children between the ages 6 and 17 does not imply a direct cause-and-effect relationship. It remains uncertain whether the presence of British influences an upward or downward trend in the level of unemployment rate among women with children between the ages 6 and 17 within an area, or if British simply ended up residing in those areas with higher or lower levels of unemployment rate among women with children between the ages 6 and 17 due to other factors.
Demographics Similar to British by Unemployment Among Women with Children Ages 6 to 17 years
In terms of unemployment among women with children ages 6 to 17 years, the demographic groups most similar to British are Turkish (8.9%, a difference of 0.050%), Immigrants from Croatia (8.9%, a difference of 0.080%), Immigrants from England (8.9%, a difference of 0.11%), Moroccan (8.9%, a difference of 0.14%), and Jordanian (9.0%, a difference of 0.14%).
| Demographics | Rating | Rank | Unemployment Among Women with Children Ages 6 to 17 years |
| Immigrants from Netherlands | 60.8 /100 | #162 | Good 8.9% |
| Mexican American Indians | 60.6 /100 | #163 | Good 8.9% |
| Ukrainians | 59.7 /100 | #164 | Average 8.9% |
| Immigrants from Micronesia | 59.2 /100 | #165 | Average 8.9% |
| Moroccans | 58.3 /100 | #166 | Average 8.9% |
| Immigrants from England | 57.7 /100 | #167 | Average 8.9% |
| Immigrants from Croatia | 57.1 /100 | #168 | Average 8.9% |
| British | 55.2 /100 | #169 | Average 8.9% |
| Turks | 54.1 /100 | #170 | Average 8.9% |
| Jordanians | 52.2 /100 | #171 | Average 9.0% |
| Immigrants from West Indies | 52.2 /100 | #172 | Average 9.0% |
| Immigrants from Brazil | 51.0 /100 | #173 | Average 9.0% |
| Immigrants from Costa Rica | 50.0 /100 | #174 | Average 9.0% |
| Immigrants from Sierra Leone | 45.9 /100 | #175 | Average 9.0% |
| Immigrants from Italy | 43.7 /100 | #176 | Average 9.0% |
British Unemployment Among Women with Children Ages 6 to 17 years Correlation Summary
| Measurement | British Data | Unemployment Among Women with Children Ages 6 to 17 years Data |
| Minimum | 0.26% | 4.9% |
| Maximum | 13.7% | 100.0% |
| Range | 13.4% | 95.1% |
| Mean | 5.0% | 29.4% |
| Median | 4.5% | 10.7% |
| Interquartile 25% (IQ1) | 2.2% | 9.1% |
| Interquartile 75% (IQ3) | 6.9% | 38.6% |
| Interquartile Range (IQR) | 4.7% | 29.5% |
| Standard Deviation (Sample) | 3.6% | 34.0% |
| Standard Deviation (Population) | 3.5% | 33.1% |
Correlation Details
| British Percentile | Sample Size | Unemployment Among Women with Children Ages 6 to 17 years |
[ 0.0% - 0.5% ] 0.26% | 198,986,901 | 10.0% |
[ 0.5% - 1.0% ] 0.70% | 110,544,856 | 8.3% |
[ 1.0% - 1.5% ] 1.20% | 25,947,533 | 8.3% |
[ 1.5% - 2.0% ] 1.71% | 5,400,509 | 9.2% |
[ 2.0% - 2.5% ] 2.19% | 1,368,684 | 10.3% |
[ 2.5% - 3.0% ] 2.70% | 441,469 | 12.5% |
[ 3.0% - 3.5% ] 3.26% | 153,760 | 11.2% |
[ 3.5% - 4.0% ] 3.68% | 158,548 | 9.1% |
[ 4.0% - 4.5% ] 4.20% | 109,005 | 9.5% |
[ 4.5% - 5.0% ] 4.79% | 29,811 | 16.9% |
[ 5.0% - 5.5% ] 5.39% | 7,627 | 4.9% |
[ 5.5% - 6.0% ] 5.78% | 17,802 | 5.9% |
[ 6.0% - 6.5% ] 6.21% | 4,556 | 38.6% |
[ 6.5% - 7.0% ] 6.86% | 583 | 90.1% |
[ 7.0% - 7.5% ] 7.26% | 840 | 21.7% |
[ 8.0% - 8.5% ] 8.19% | 452 | 62.5% |
[ 11.0% - 11.5% ] 11.24% | 89 | 100.0% |
[ 13.5% - 14.0% ] 13.70% | 146 | 100.0% |