British GED/Equivalency
COMPARE
British
Select to Compare
GED/Equivalency
British GED/Equivalency
87.8%
GED/EQUIVALENCY
99.1/ 100
METRIC RATING
67th/ 347
METRIC RANK
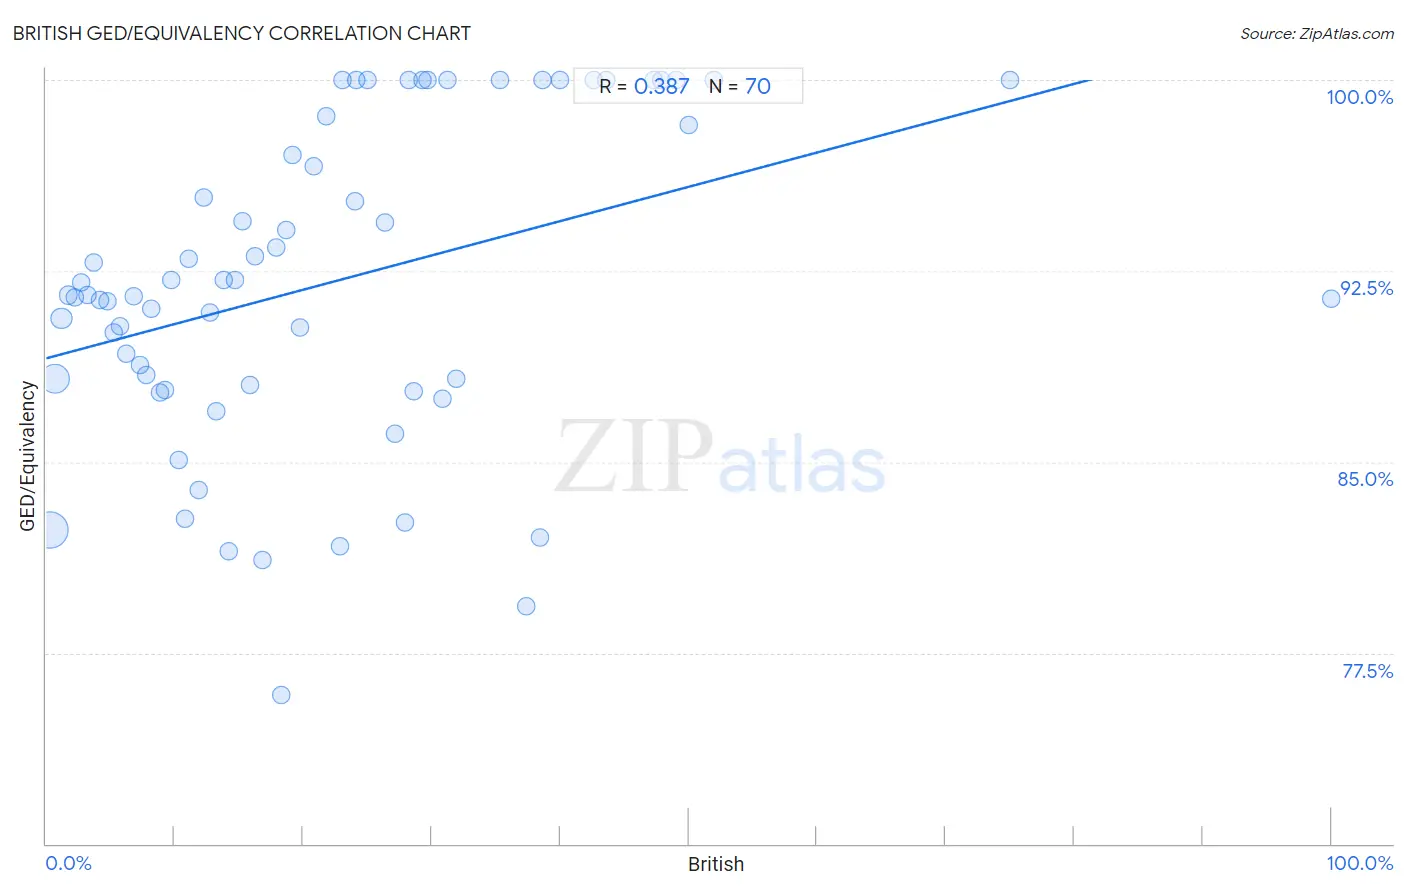
British GED/Equivalency Correlation Chart
The statistical analysis conducted on geographies consisting of 531,463,395 people shows a mild positive correlation between the proportion of British and percentage of population with at least ged/equivalency education in the United States with a correlation coefficient (R) of 0.387 and weighted average of 87.8%. On average, for every 1% (one percent) increase in British within a typical geography, there is an increase of 0.13% in percentage of population with at least ged/equivalency education.
It is essential to understand that the correlation between the percentage of British and percentage of population with at least ged/equivalency education does not imply a direct cause-and-effect relationship. It remains uncertain whether the presence of British influences an upward or downward trend in the level of percentage of population with at least ged/equivalency education within an area, or if British simply ended up residing in those areas with higher or lower levels of percentage of population with at least ged/equivalency education due to other factors.
Demographics Similar to British by GED/Equivalency
In terms of ged/equivalency, the demographic groups most similar to British are Immigrants from France (87.8%, a difference of 0.0%), Immigrants from North America (87.8%, a difference of 0.010%), Immigrants from Bulgaria (87.8%, a difference of 0.010%), Immigrants from Canada (87.9%, a difference of 0.050%), and Immigrants from Saudi Arabia (87.8%, a difference of 0.070%).
| Demographics | Rating | Rank | GED/Equivalency |
| Scandinavians | 99.3 /100 | #60 | Exceptional 87.9% |
| Europeans | 99.3 /100 | #61 | Exceptional 87.9% |
| Germans | 99.3 /100 | #62 | Exceptional 87.9% |
| Immigrants from Turkey | 99.2 /100 | #63 | Exceptional 87.9% |
| Immigrants from Canada | 99.2 /100 | #64 | Exceptional 87.9% |
| Immigrants from North America | 99.1 /100 | #65 | Exceptional 87.8% |
| Immigrants from Bulgaria | 99.1 /100 | #66 | Exceptional 87.8% |
| British | 99.1 /100 | #67 | Exceptional 87.8% |
| Immigrants from France | 99.1 /100 | #68 | Exceptional 87.8% |
| Immigrants from Saudi Arabia | 99.0 /100 | #69 | Exceptional 87.8% |
| Ukrainians | 98.8 /100 | #70 | Exceptional 87.7% |
| Austrians | 98.8 /100 | #71 | Exceptional 87.7% |
| Immigrants from Moldova | 98.8 /100 | #72 | Exceptional 87.7% |
| Belgians | 98.8 /100 | #73 | Exceptional 87.7% |
| Immigrants from Kuwait | 98.8 /100 | #74 | Exceptional 87.7% |
British GED/Equivalency Correlation Summary
| Measurement | British Data | GED/Equivalency Data |
| Minimum | 0.26% | 75.9% |
| Maximum | 100.0% | 100.0% |
| Range | 99.7% | 24.1% |
| Mean | 21.9% | 92.0% |
| Median | 18.1% | 91.5% |
| Interquartile 25% (IQ1) | 8.8% | 88.0% |
| Interquartile 75% (IQ3) | 29.7% | 98.6% |
| Interquartile Range (IQR) | 20.8% | 10.6% |
| Standard Deviation (Sample) | 18.0% | 6.3% |
| Standard Deviation (Population) | 17.9% | 6.2% |
Correlation Details
| British Percentile | Sample Size | GED/Equivalency |
[ 0.0% - 0.5% ] 0.26% | 285,741,600 | 82.3% |
[ 0.5% - 1.0% ] 0.71% | 172,339,270 | 88.2% |
[ 1.0% - 1.5% ] 1.20% | 49,866,627 | 90.6% |
[ 1.5% - 2.0% ] 1.70% | 13,992,560 | 91.5% |
[ 2.0% - 2.5% ] 2.22% | 4,981,850 | 91.5% |
[ 2.5% - 3.0% ] 2.73% | 2,091,932 | 92.0% |
[ 3.0% - 3.5% ] 3.23% | 805,958 | 91.5% |
[ 3.5% - 4.0% ] 3.74% | 646,625 | 92.9% |
[ 4.0% - 4.5% ] 4.20% | 364,908 | 91.4% |
[ 4.5% - 5.0% ] 4.73% | 153,533 | 91.3% |
[ 5.0% - 5.5% ] 5.30% | 82,315 | 90.1% |
[ 5.5% - 6.0% ] 5.78% | 58,416 | 90.3% |
[ 6.0% - 6.5% ] 6.22% | 53,009 | 89.2% |
[ 6.5% - 7.0% ] 6.77% | 49,953 | 91.5% |
[ 7.0% - 7.5% ] 7.26% | 46,432 | 88.8% |
[ 7.5% - 8.0% ] 7.74% | 36,998 | 88.4% |
[ 8.0% - 8.5% ] 8.19% | 39,318 | 91.0% |
[ 8.5% - 9.0% ] 8.83% | 21,482 | 87.7% |
[ 9.0% - 9.5% ] 9.23% | 13,698 | 87.8% |
[ 9.5% - 10.0% ] 9.76% | 7,347 | 92.1% |
[ 10.0% - 10.5% ] 10.28% | 13,450 | 85.1% |
[ 10.5% - 11.0% ] 10.82% | 9,351 | 82.7% |
[ 11.0% - 11.5% ] 11.09% | 2,822 | 93.0% |
[ 11.5% - 12.0% ] 11.85% | 4,978 | 83.9% |
[ 12.0% - 12.5% ] 12.29% | 3,303 | 95.4% |
[ 12.5% - 13.0% ] 12.74% | 2,755 | 90.9% |
[ 13.0% - 13.5% ] 13.21% | 4,843 | 87.0% |
[ 13.5% - 14.0% ] 13.79% | 1,327 | 92.1% |
[ 14.0% - 14.5% ] 14.22% | 4,333 | 81.5% |
[ 14.5% - 15.0% ] 14.70% | 925 | 92.1% |
[ 15.0% - 15.5% ] 15.32% | 581 | 94.4% |
[ 15.5% - 16.0% ] 15.82% | 4,381 | 88.0% |
[ 16.0% - 16.5% ] 16.24% | 4,808 | 93.1% |
[ 16.5% - 17.0% ] 16.83% | 523 | 81.1% |
[ 17.5% - 18.0% ] 17.87% | 621 | 93.4% |
[ 18.0% - 18.5% ] 18.32% | 917 | 75.9% |
[ 18.5% - 19.0% ] 18.71% | 994 | 94.1% |
[ 19.0% - 19.5% ] 19.14% | 1,599 | 97.1% |
[ 19.5% - 20.0% ] 19.70% | 269 | 90.3% |
[ 20.5% - 21.0% ] 20.84% | 523 | 96.6% |
[ 21.5% - 22.0% ] 21.80% | 445 | 98.6% |
[ 22.5% - 23.0% ] 22.84% | 324 | 81.7% |
[ 23.0% - 23.5% ] 23.08% | 143 | 100.0% |
[ 24.0% - 24.5% ] 24.00% | 25 | 95.2% |
[ 24.0% - 24.5% ] 24.15% | 265 | 100.0% |
[ 25.0% - 25.5% ] 25.00% | 76 | 100.0% |
[ 26.0% - 26.5% ] 26.34% | 505 | 94.4% |
[ 27.0% - 27.5% ] 27.18% | 309 | 86.1% |
[ 27.5% - 28.0% ] 27.92% | 745 | 82.6% |
[ 28.0% - 28.5% ] 28.21% | 156 | 100.0% |
[ 28.5% - 29.0% ] 28.57% | 49 | 87.8% |
[ 29.0% - 29.5% ] 29.31% | 58 | 100.0% |
[ 29.5% - 30.0% ] 29.66% | 118 | 100.0% |
[ 30.5% - 31.0% ] 30.87% | 311 | 87.5% |
[ 31.0% - 31.5% ] 31.20% | 125 | 100.0% |
[ 31.5% - 32.0% ] 31.89% | 1,063 | 88.3% |
[ 35.0% - 35.5% ] 35.29% | 51 | 100.0% |
[ 37.0% - 37.5% ] 37.37% | 99 | 79.3% |
[ 38.0% - 38.5% ] 38.46% | 39 | 82.1% |
[ 38.5% - 39.0% ] 38.60% | 57 | 100.0% |
[ 40.0% - 40.5% ] 40.00% | 135 | 100.0% |
[ 42.5% - 43.0% ] 42.65% | 68 | 100.0% |
[ 43.5% - 44.0% ] 43.55% | 287 | 100.0% |
[ 47.0% - 47.5% ] 47.27% | 366 | 100.0% |
[ 47.5% - 48.0% ] 47.83% | 69 | 100.0% |
[ 48.5% - 49.0% ] 48.98% | 49 | 100.0% |
[ 50.0% - 50.5% ] 50.00% | 56 | 98.2% |
[ 51.5% - 52.0% ] 51.95% | 154 | 100.0% |
[ 75.0% - 75.5% ] 75.00% | 44 | 100.0% |
[ 99.5% - 100.0% ] 100.00% | 70 | 91.4% |