British 2 or more Vehicles in Household
COMPARE
British
Select to Compare
2 or more Vehicles in Household
British 2 or more Vehicles in Household
60.0%
2+ VEHICLES AVAILABLE
100.0/ 100
METRIC RATING
39th/ 347
METRIC RANK
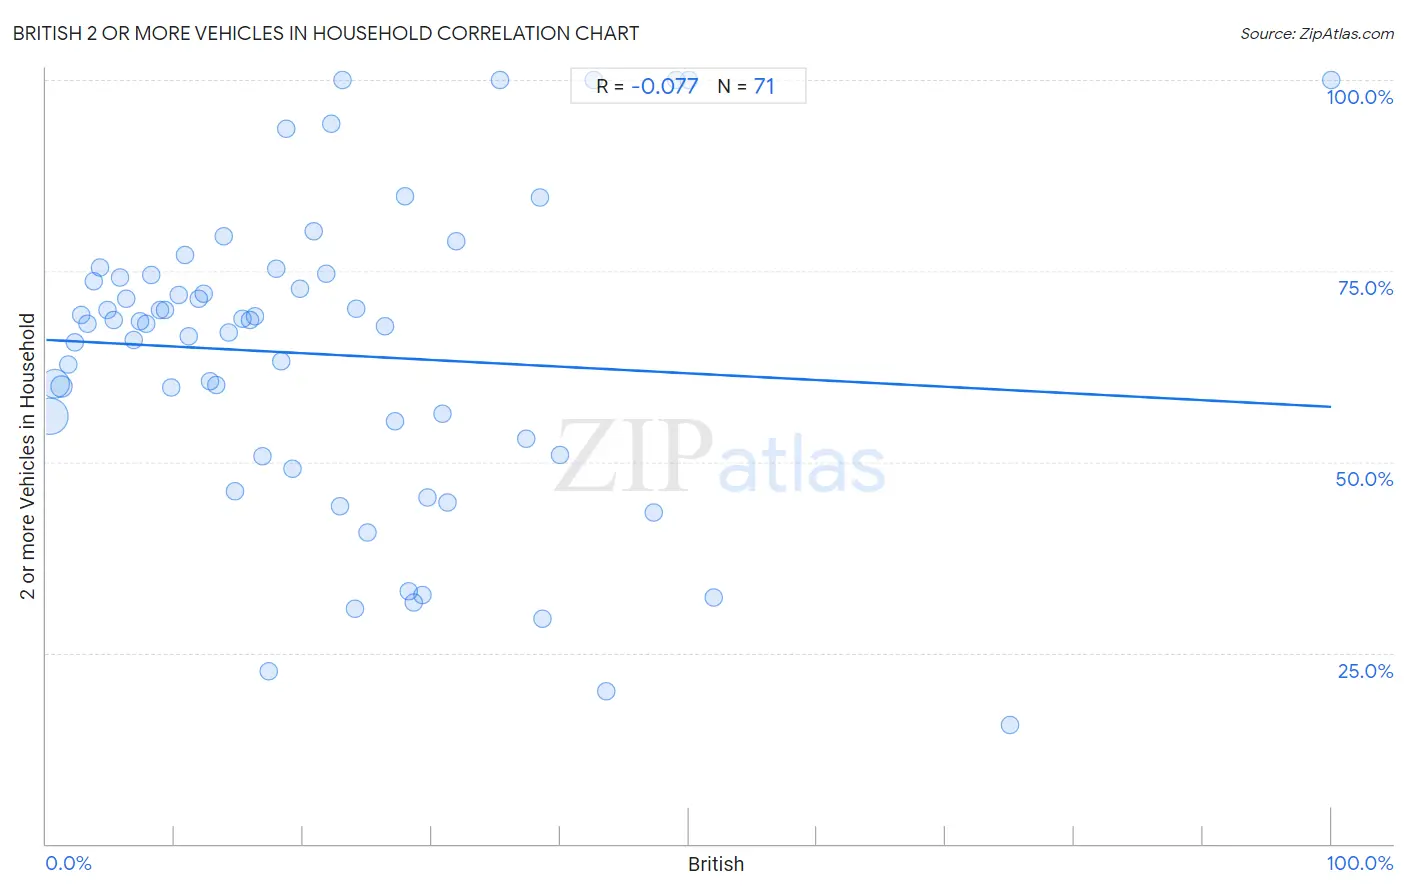
British 2 or more Vehicles in Household Correlation Chart
The statistical analysis conducted on geographies consisting of 531,069,536 people shows a slight negative correlation between the proportion of British and percentage of households with 2 or more vehicles available in the United States with a correlation coefficient (R) of -0.077 and weighted average of 60.0%. On average, for every 1% (one percent) increase in British within a typical geography, there is a decrease of 0.088% in percentage of households with 2 or more vehicles available.
It is essential to understand that the correlation between the percentage of British and percentage of households with 2 or more vehicles available does not imply a direct cause-and-effect relationship. It remains uncertain whether the presence of British influences an upward or downward trend in the level of percentage of households with 2 or more vehicles available within an area, or if British simply ended up residing in those areas with higher or lower levels of percentage of households with 2 or more vehicles available due to other factors.
Demographics Similar to British by 2 or more Vehicles in Household
In terms of 2 or more vehicles in household, the demographic groups most similar to British are American (60.0%, a difference of 0.0%), Irish (60.1%, a difference of 0.070%), Chinese (60.1%, a difference of 0.10%), Immigrants from Philippines (60.1%, a difference of 0.12%), and Spanish (60.2%, a difference of 0.25%).
| Demographics | Rating | Rank | 2 or more Vehicles in Household |
| Arapaho | 100.0 /100 | #32 | Exceptional 60.2% |
| Immigrants from Mexico | 100.0 /100 | #33 | Exceptional 60.2% |
| Spanish | 100.0 /100 | #34 | Exceptional 60.2% |
| Immigrants from Philippines | 100.0 /100 | #35 | Exceptional 60.1% |
| Chinese | 100.0 /100 | #36 | Exceptional 60.1% |
| Irish | 100.0 /100 | #37 | Exceptional 60.1% |
| Americans | 100.0 /100 | #38 | Exceptional 60.0% |
| British | 100.0 /100 | #39 | Exceptional 60.0% |
| Cherokee | 100.0 /100 | #40 | Exceptional 59.9% |
| Northern Europeans | 100.0 /100 | #41 | Exceptional 59.9% |
| Malaysians | 100.0 /100 | #42 | Exceptional 59.8% |
| Czechoslovakians | 100.0 /100 | #43 | Exceptional 59.8% |
| French | 100.0 /100 | #44 | Exceptional 59.8% |
| Immigrants from Taiwan | 100.0 /100 | #45 | Exceptional 59.7% |
| Immigrants from South Eastern Asia | 100.0 /100 | #46 | Exceptional 59.6% |
British 2 or more Vehicles in Household Correlation Summary
| Measurement | British Data | 2 or more Vehicles in Household Data |
| Minimum | 0.26% | 15.6% |
| Maximum | 100.0% | 100.0% |
| Range | 99.7% | 84.4% |
| Mean | 21.5% | 64.1% |
| Median | 17.9% | 68.1% |
| Interquartile 25% (IQ1) | 8.8% | 50.8% |
| Interquartile 75% (IQ3) | 29.3% | 74.5% |
| Interquartile Range (IQR) | 20.5% | 23.7% |
| Standard Deviation (Sample) | 17.6% | 20.1% |
| Standard Deviation (Population) | 17.5% | 20.0% |
Correlation Details
| British Percentile | Sample Size | 2 or more Vehicles in Household |
[ 0.0% - 0.5% ] 0.26% | 285,570,025 | 55.9% |
[ 0.5% - 1.0% ] 0.71% | 172,190,696 | 60.2% |
[ 1.0% - 1.5% ] 1.20% | 49,834,685 | 59.9% |
[ 1.5% - 2.0% ] 1.70% | 13,986,381 | 62.8% |
[ 2.0% - 2.5% ] 2.22% | 4,969,218 | 65.6% |
[ 2.5% - 3.0% ] 2.73% | 2,082,069 | 69.3% |
[ 3.0% - 3.5% ] 3.23% | 796,468 | 68.1% |
[ 3.5% - 4.0% ] 3.74% | 645,980 | 73.6% |
[ 4.0% - 4.5% ] 4.19% | 364,636 | 75.5% |
[ 4.5% - 5.0% ] 4.73% | 151,064 | 69.8% |
[ 5.0% - 5.5% ] 5.30% | 82,315 | 68.6% |
[ 5.5% - 6.0% ] 5.78% | 58,416 | 74.1% |
[ 6.0% - 6.5% ] 6.22% | 53,009 | 71.3% |
[ 6.5% - 7.0% ] 6.77% | 49,953 | 65.9% |
[ 7.0% - 7.5% ] 7.26% | 46,432 | 68.4% |
[ 7.5% - 8.0% ] 7.73% | 36,458 | 68.1% |
[ 8.0% - 8.5% ] 8.19% | 39,318 | 74.5% |
[ 8.5% - 9.0% ] 8.83% | 21,482 | 69.8% |
[ 9.0% - 9.5% ] 9.23% | 13,698 | 70.0% |
[ 9.5% - 10.0% ] 9.76% | 7,347 | 59.7% |
[ 10.0% - 10.5% ] 10.28% | 13,450 | 71.8% |
[ 10.5% - 11.0% ] 10.82% | 9,351 | 77.1% |
[ 11.0% - 11.5% ] 11.09% | 2,822 | 66.4% |
[ 11.5% - 12.0% ] 11.85% | 4,978 | 71.3% |
[ 12.0% - 12.5% ] 12.29% | 3,303 | 72.1% |
[ 12.5% - 13.0% ] 12.74% | 2,755 | 60.6% |
[ 13.0% - 13.5% ] 13.21% | 4,843 | 60.1% |
[ 13.5% - 14.0% ] 13.79% | 1,327 | 79.5% |
[ 14.0% - 14.5% ] 14.22% | 4,333 | 67.0% |
[ 14.5% - 15.0% ] 14.70% | 925 | 46.1% |
[ 15.0% - 15.5% ] 15.32% | 581 | 68.7% |
[ 15.5% - 16.0% ] 15.82% | 4,381 | 68.6% |
[ 16.0% - 16.5% ] 16.24% | 4,808 | 69.1% |
[ 16.5% - 17.0% ] 16.83% | 523 | 50.7% |
[ 17.0% - 17.5% ] 17.29% | 133 | 22.6% |
[ 17.5% - 18.0% ] 17.87% | 621 | 75.3% |
[ 18.0% - 18.5% ] 18.33% | 884 | 63.2% |
[ 18.5% - 19.0% ] 18.71% | 994 | 93.6% |
[ 19.0% - 19.5% ] 19.14% | 1,599 | 49.2% |
[ 19.5% - 20.0% ] 19.70% | 269 | 72.7% |
[ 20.5% - 21.0% ] 20.84% | 523 | 80.1% |
[ 21.5% - 22.0% ] 21.80% | 445 | 74.6% |
[ 22.0% - 22.5% ] 22.17% | 442 | 94.2% |
[ 22.5% - 23.0% ] 22.84% | 324 | 44.1% |
[ 23.0% - 23.5% ] 23.08% | 143 | 100.0% |
[ 24.0% - 24.5% ] 24.00% | 25 | 30.8% |
[ 24.0% - 24.5% ] 24.15% | 265 | 70.1% |
[ 25.0% - 25.5% ] 25.00% | 76 | 40.7% |
[ 26.0% - 26.5% ] 26.34% | 505 | 67.7% |
[ 27.0% - 27.5% ] 27.18% | 309 | 55.4% |
[ 27.5% - 28.0% ] 27.92% | 745 | 84.8% |
[ 28.0% - 28.5% ] 28.21% | 156 | 33.1% |
[ 28.5% - 29.0% ] 28.57% | 28 | 31.6% |
[ 29.0% - 29.5% ] 29.31% | 58 | 32.6% |
[ 29.5% - 30.0% ] 29.66% | 118 | 45.3% |
[ 30.5% - 31.0% ] 30.83% | 240 | 56.3% |
[ 31.0% - 31.5% ] 31.20% | 125 | 44.6% |
[ 31.5% - 32.0% ] 31.89% | 1,063 | 78.9% |
[ 35.0% - 35.5% ] 35.29% | 51 | 100.0% |
[ 37.0% - 37.5% ] 37.37% | 99 | 53.0% |
[ 38.0% - 38.5% ] 38.46% | 39 | 84.6% |
[ 38.5% - 39.0% ] 38.60% | 57 | 29.4% |
[ 40.0% - 40.5% ] 40.00% | 135 | 50.8% |
[ 42.5% - 43.0% ] 42.65% | 68 | 100.0% |
[ 43.5% - 44.0% ] 43.55% | 287 | 19.9% |
[ 47.0% - 47.5% ] 47.26% | 347 | 43.4% |
[ 48.5% - 49.0% ] 48.98% | 49 | 100.0% |
[ 50.0% - 50.5% ] 50.00% | 56 | 100.0% |
[ 51.5% - 52.0% ] 51.95% | 154 | 32.2% |
[ 75.0% - 75.5% ] 75.00% | 44 | 15.6% |
[ 99.5% - 100.0% ] 100.00% | 30 | 100.0% |