Bermudan Married-couple Households
COMPARE
Bermudan
Select to Compare
Married-couple Households
Bermudan Married-couple Households
42.4%
MARRIED-COUPLE HOUSEHOLDS
0.0/ 100
METRIC RATING
282nd/ 347
METRIC RANK
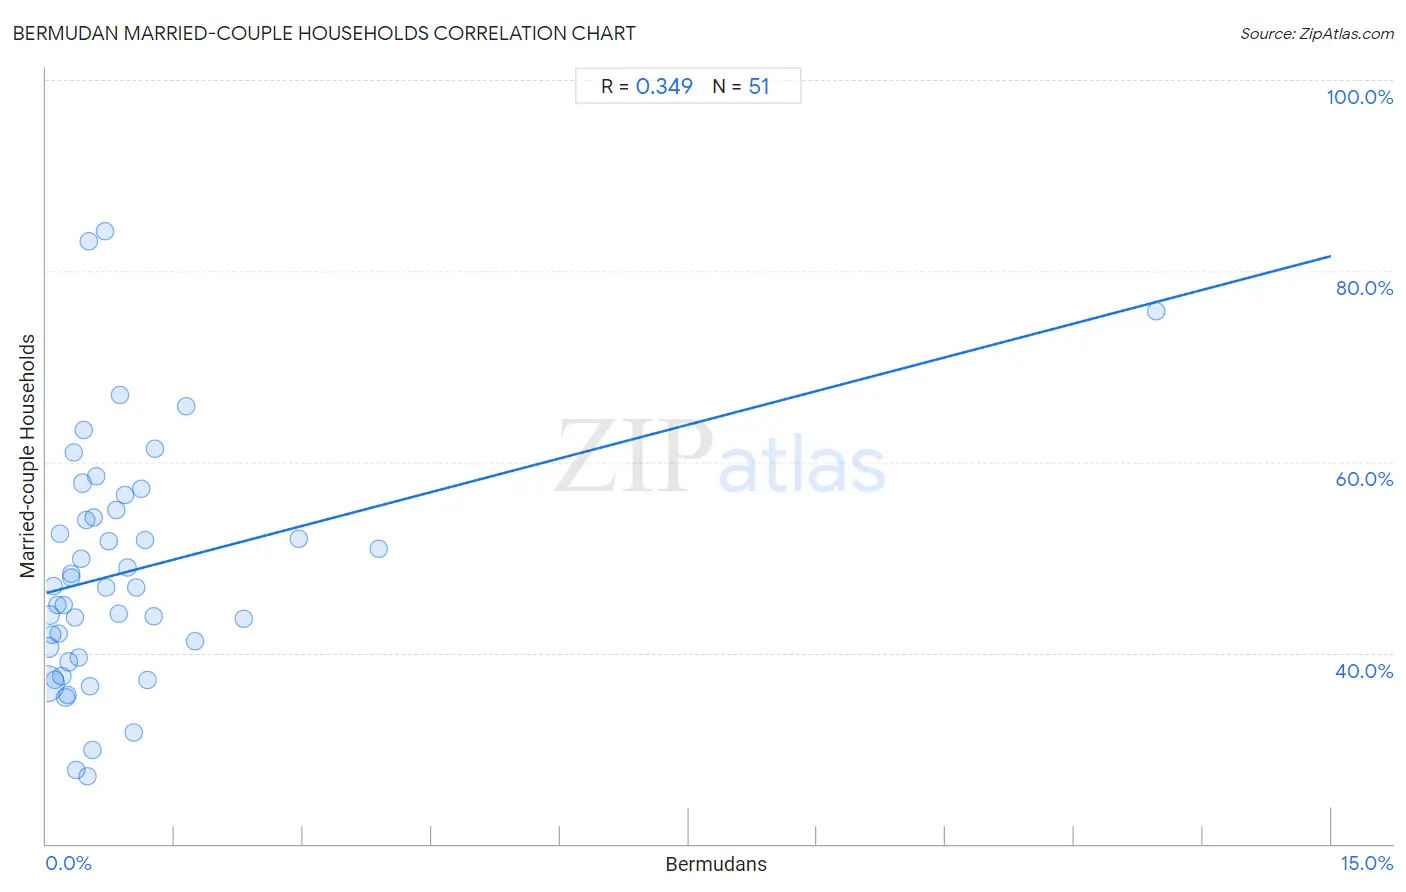
Bermudan Married-couple Households Correlation Chart
The statistical analysis conducted on geographies consisting of 55,716,155 people shows a mild positive correlation between the proportion of Bermudans and percentage of married-couple family households in the United States with a correlation coefficient (R) of 0.349 and weighted average of 42.4%. On average, for every 1% (one percent) increase in Bermudans within a typical geography, there is an increase of 2.4% in percentage of married-couple family households.
It is essential to understand that the correlation between the percentage of Bermudans and percentage of married-couple family households does not imply a direct cause-and-effect relationship. It remains uncertain whether the presence of Bermudans influences an upward or downward trend in the level of percentage of married-couple family households within an area, or if Bermudans simply ended up residing in those areas with higher or lower levels of percentage of married-couple family households due to other factors.
Demographics Similar to Bermudans by Married-couple Households
In terms of married-couple households, the demographic groups most similar to Bermudans are Inupiat (42.4%, a difference of 0.10%), Cheyenne (42.3%, a difference of 0.46%), Ghanaian (42.2%, a difference of 0.49%), Belizean (42.2%, a difference of 0.50%), and Chippewa (42.1%, a difference of 0.73%).
| Demographics | Rating | Rank | Married-couple Households |
| Immigrants from Bangladesh | 0.0 /100 | #275 | Tragic 43.1% |
| Immigrants from Ethiopia | 0.0 /100 | #276 | Tragic 43.1% |
| Immigrants from Eastern Africa | 0.0 /100 | #277 | Tragic 42.9% |
| Immigrants from Africa | 0.0 /100 | #278 | Tragic 42.9% |
| Sierra Leoneans | 0.0 /100 | #279 | Tragic 42.9% |
| Immigrants from Ecuador | 0.0 /100 | #280 | Tragic 42.9% |
| Immigrants from Guatemala | 0.0 /100 | #281 | Tragic 42.8% |
| Bermudans | 0.0 /100 | #282 | Tragic 42.4% |
| Inupiat | 0.0 /100 | #283 | Tragic 42.4% |
| Cheyenne | 0.0 /100 | #284 | Tragic 42.3% |
| Ghanaians | 0.0 /100 | #285 | Tragic 42.2% |
| Belizeans | 0.0 /100 | #286 | Tragic 42.2% |
| Chippewa | 0.0 /100 | #287 | Tragic 42.1% |
| Immigrants from Eritrea | 0.0 /100 | #288 | Tragic 42.1% |
| Sudanese | 0.0 /100 | #289 | Tragic 42.1% |
Bermudan Married-couple Households Correlation Summary
| Measurement | Bermudan Data | Married-couple Households Data |
| Minimum | 0.0057% | 27.0% |
| Maximum | 13.0% | 84.2% |
| Range | 13.0% | 57.1% |
| Mean | 0.96% | 48.5% |
| Median | 0.49% | 46.9% |
| Interquartile 25% (IQ1) | 0.25% | 39.6% |
| Interquartile 75% (IQ3) | 1.0% | 55.0% |
| Interquartile Range (IQR) | 0.77% | 15.4% |
| Standard Deviation (Sample) | 1.9% | 12.6% |
| Standard Deviation (Population) | 1.8% | 12.5% |
Correlation Details
| Bermudan Percentile | Sample Size | Married-couple Households |
[ 0.0% - 0.5% ] 0.0057% | 42,083,122 | 36.7% |
[ 0.0% - 0.5% ] 0.027% | 5,755,745 | 40.5% |
[ 0.0% - 0.5% ] 0.046% | 2,608,681 | 43.9% |
[ 0.0% - 0.5% ] 0.067% | 1,350,230 | 41.9% |
[ 0.0% - 0.5% ] 0.087% | 877,732 | 47.0% |
[ 0.0% - 0.5% ] 0.11% | 582,211 | 37.1% |
[ 0.0% - 0.5% ] 0.13% | 180,201 | 45.0% |
[ 0.0% - 0.5% ] 0.15% | 364,446 | 42.0% |
[ 0.0% - 0.5% ] 0.16% | 196,469 | 52.4% |
[ 0.0% - 0.5% ] 0.18% | 329,041 | 37.5% |
[ 0.0% - 0.5% ] 0.20% | 212,772 | 45.0% |
[ 0.0% - 0.5% ] 0.23% | 122,993 | 35.3% |
[ 0.0% - 0.5% ] 0.25% | 59,223 | 35.6% |
[ 0.0% - 0.5% ] 0.26% | 194,033 | 39.1% |
[ 0.0% - 0.5% ] 0.29% | 82,847 | 48.2% |
[ 0.0% - 0.5% ] 0.30% | 99,459 | 47.9% |
[ 0.0% - 0.5% ] 0.32% | 29,910 | 61.0% |
[ 0.0% - 0.5% ] 0.34% | 40,373 | 43.6% |
[ 0.0% - 0.5% ] 0.35% | 73,995 | 27.8% |
[ 0.0% - 0.5% ] 0.38% | 17,671 | 39.6% |
[ 0.0% - 0.5% ] 0.40% | 23,335 | 49.8% |
[ 0.0% - 0.5% ] 0.42% | 72,989 | 57.8% |
[ 0.0% - 0.5% ] 0.44% | 3,212 | 63.3% |
[ 0.0% - 0.5% ] 0.46% | 45,269 | 53.9% |
[ 0.0% - 0.5% ] 0.48% | 33,523 | 27.0% |
[ 0.0% - 0.5% ] 0.49% | 2,039 | 83.1% |
[ 0.5% - 1.0% ] 0.51% | 7,648 | 36.5% |
[ 0.5% - 1.0% ] 0.54% | 48,361 | 29.8% |
[ 0.5% - 1.0% ] 0.55% | 62,891 | 54.2% |
[ 0.5% - 1.0% ] 0.59% | 3,406 | 58.5% |
[ 0.5% - 1.0% ] 0.68% | 2,050 | 84.2% |
[ 0.5% - 1.0% ] 0.70% | 5,115 | 46.9% |
[ 0.5% - 1.0% ] 0.73% | 2,731 | 51.7% |
[ 0.5% - 1.0% ] 0.82% | 10,602 | 55.0% |
[ 0.5% - 1.0% ] 0.85% | 51,938 | 44.1% |
[ 0.5% - 1.0% ] 0.86% | 3,006 | 67.0% |
[ 0.5% - 1.0% ] 0.92% | 5,338 | 56.5% |
[ 0.5% - 1.0% ] 0.95% | 4,221 | 48.9% |
[ 1.0% - 1.5% ] 1.01% | 24,551 | 31.6% |
[ 1.0% - 1.5% ] 1.05% | 1,818 | 46.9% |
[ 1.0% - 1.5% ] 1.12% | 896 | 57.2% |
[ 1.0% - 1.5% ] 1.16% | 9,767 | 51.8% |
[ 1.0% - 1.5% ] 1.18% | 932 | 37.1% |
[ 1.0% - 1.5% ] 1.25% | 8,002 | 43.9% |
[ 1.0% - 1.5% ] 1.27% | 8,326 | 61.3% |
[ 1.5% - 2.0% ] 1.64% | 2,690 | 65.9% |
[ 1.5% - 2.0% ] 1.73% | 173 | 41.2% |
[ 2.0% - 2.5% ] 2.31% | 3,770 | 43.6% |
[ 2.5% - 3.0% ] 2.94% | 374 | 52.0% |
[ 3.5% - 4.0% ] 3.89% | 5,480 | 50.9% |
[ 12.5% - 13.0% ] 12.96% | 548 | 75.8% |