Bermudan GED/Equivalency

COMPARE

Bermudan
Race
Ancestry
AfghanAfricanAlaska NativeAlaskan AthabascanAlbanianAleutAlsatianAmericanApacheArabArapahoArgentineanArmenianAssyrian/Chaldean/SyriacAustralianAustrianBahamianBangladeshiBarbadianBasqueBelgianBelizeanBermudanBhutaneseBlackfeetBolivianBrazilianBritishBritish West IndianBulgarianBurmeseCajunCambodianCanadianCape VerdeanCarpatho RusynCelticCentral AmericanCentral American IndianCherokeeCheyenneChickasawChileanChineseChippewaChoctawColombianColvilleComancheCosta RicanCreeCreekCroatianCrowCubanCypriotCzechCzechoslovakianDanishDelawareDominicanDutchDutch West IndianEastern EuropeanEcuadorianEgyptianEnglishEstonianEthiopianEuropeanFijianFilipinoFinnishFrenchFrench American IndianFrench CanadianGermanGerman RussianGhanaianGreekGuamanian/ChamorroGuatemalanGuyaneseHaitianHmongHonduranHopiHoumaHungarianIcelanderIndian (Asian)IndonesianInupiatIranianIraqiIrishIroquoisIsraeliItalianJamaicanJapaneseJordanianKenyanKiowaKoreanLaotianLatvianLebaneseLiberianLithuanianLumbeeLuxembourgerMacedonianMalaysianMalteseMarshalleseMenomineeMexicanMexican American IndianMongolianMoroccanNative HawaiianNavajoNepaleseNew ZealanderNicaraguanNigerianNorthern EuropeanNorwegianOkinawanOsageOttawaPaiutePakistaniPalestinianPanamanianParaguayanPennsylvania GermanPeruvianPimaPolishPortuguesePotawatomiPuebloPuerto RicanPuget Sound SalishRomanianRussianSalvadoranSamoanScandinavianScotch-IrishScottishSeminoleSenegaleseSerbianShoshoneSierra LeoneanSiouxSlavicSlovakSloveneSomaliSouth AfricanSouth AmericanSouth American IndianSoviet UnionSpaniardSpanishSpanish AmericanSpanish American IndianSri LankanSubsaharan AfricanSudaneseSwedishSwissSyrianTaiwaneseThaiTlingit-HaidaTohono O'OdhamTonganTrinidadian and TobagonianTsimshianTurkishU.S. Virgin IslanderUgandanUkrainianUruguayanUteVenezuelanVietnameseWelshWest IndianYakamaYaquiYugoslavianYumanYup'ikZimbabwean
Immigration
NonimmigrantsImmigrantsAfghanistanAfricaAlbaniaArgentinaArmeniaAsiaAustraliaAustriaBahamasBangladeshBarbadosBelarusBelgiumBelizeBoliviaBosnia and HerzegovinaBrazilBulgariaBurma/MyanmarCabo VerdeCambodiaCameroonCanadaCaribbeanCentral AmericaChileChinaColombiaCongoCosta RicaCroatiaCubaCzechoslovakiaDenmarkDominicaDominican RepublicEastern AfricaEastern AsiaEastern EuropeEcuadorEgyptEl SalvadorEnglandEritreaEthiopiaEuropeFijiFranceGermanyGhanaGreeceGrenadaGuatemalaGuyanaHaitiHondurasHong KongHungaryIndiaIndonesiaIranIraqIrelandIsraelItalyJamaicaJapanJordanKazakhstanKenyaKoreaKuwaitLaosLatin AmericaLatviaLebanonLiberiaLithuaniaMalaysiaMexicoMicronesiaMiddle AfricaMoldovaMoroccoNepalNetherlandsNicaraguaNigeriaNorth AmericaNorth MacedoniaNorthern AfricaNorthern EuropeNorwayOceaniaPakistanPanamaPeruPhilippinesPolandPortugalRomaniaRussiaSaudi ArabiaScotlandSenegalSerbiaSierra LeoneSingaporeSomaliaSouth AfricaSouth AmericaSouth Central AsiaSouth Eastern AsiaSouthern EuropeSpainSri LankaSt. Vincent and the GrenadinesSudanSwedenSwitzerlandSyriaTaiwanThailandTrinidad and TobagoTurkeyUgandaUkraineUruguayUzbekistanVenezuelaVietnamWest IndiesWestern AfricaWestern AsiaWestern EuropeYemenZaireZimbabweAzores
Select to Compare
Race
Ancestry
AfghanAfricanAlaska NativeAlaskan AthabascanAlbanianAleutAlsatianAmericanApacheArabArapahoArgentineanArmenianAssyrian/Chaldean/SyriacAustralianAustrianBahamianBangladeshiBarbadianBasqueBelgianBelizeanBhutaneseBlackfeetBolivianBrazilianBritishBritish West IndianBulgarianBurmeseCajunCambodianCanadianCape VerdeanCarpatho RusynCelticCentral AmericanCentral American IndianCherokeeCheyenneChickasawChileanChineseChippewaChoctawColombianColvilleComancheCosta RicanCreeCreekCroatianCrowCubanCypriotCzechCzechoslovakianDanishDelawareDominicanDutchDutch West IndianEastern EuropeanEcuadorianEgyptianEnglishEstonianEthiopianEuropeanFijianFilipinoFinnishFrenchFrench American IndianFrench CanadianGermanGerman RussianGhanaianGreekGuamanian/ChamorroGuatemalanGuyaneseHaitianHmongHonduranHopiHoumaHungarianIcelanderIndian (Asian)IndonesianInupiatIranianIraqiIrishIroquoisIsraeliItalianJamaicanJapaneseJordanianKenyanKiowaKoreanLaotianLatvianLebaneseLiberianLithuanianLumbeeLuxembourgerMacedonianMalaysianMalteseMarshalleseMenomineeMexicanMexican American IndianMongolianMoroccanNative HawaiianNavajoNepaleseNew ZealanderNicaraguanNigerianNorthern EuropeanNorwegianOkinawanOsageOttawaPaiutePakistaniPalestinianPanamanianParaguayanPennsylvania GermanPeruvianPimaPolishPortuguesePotawatomiPuebloPuerto RicanPuget Sound SalishRomanianRussianSalvadoranSamoanScandinavianScotch-IrishScottishSeminoleSenegaleseSerbianShoshoneSierra LeoneanSiouxSlavicSlovakSloveneSomaliSouth AfricanSouth AmericanSouth American IndianSoviet UnionSpaniardSpanishSpanish AmericanSpanish American IndianSri LankanSubsaharan AfricanSudaneseSwedishSwissSyrianTaiwaneseThaiTlingit-HaidaTohono O'OdhamTonganTrinidadian and TobagonianTsimshianTurkishU.S. Virgin IslanderUgandanUkrainianUruguayanUteVenezuelanVietnameseWelshWest IndianYakamaYaquiYugoslavianYumanYup'ikZimbabwean
Immigration
NonimmigrantsImmigrantsAfghanistanAfricaAlbaniaArgentinaArmeniaAsiaAustraliaAustriaBahamasBangladeshBarbadosBelarusBelgiumBelizeBoliviaBosnia and HerzegovinaBrazilBulgariaBurma/MyanmarCabo VerdeCambodiaCameroonCanadaCaribbeanCentral AmericaChileChinaColombiaCongoCosta RicaCroatiaCubaCzechoslovakiaDenmarkDominicaDominican RepublicEastern AfricaEastern AsiaEastern EuropeEcuadorEgyptEl SalvadorEnglandEritreaEthiopiaEuropeFijiFranceGermanyGhanaGreeceGrenadaGuatemalaGuyanaHaitiHondurasHong KongHungaryIndiaIndonesiaIranIraqIrelandIsraelItalyJamaicaJapanJordanKazakhstanKenyaKoreaKuwaitLaosLatin AmericaLatviaLebanonLiberiaLithuaniaMalaysiaMexicoMicronesiaMiddle AfricaMoldovaMoroccoNepalNetherlandsNicaraguaNigeriaNorth AmericaNorth MacedoniaNorthern AfricaNorthern EuropeNorwayOceaniaPakistanPanamaPeruPhilippinesPolandPortugalRomaniaRussiaSaudi ArabiaScotlandSenegalSerbiaSierra LeoneSingaporeSomaliaSouth AfricaSouth AmericaSouth Central AsiaSouth Eastern AsiaSouthern EuropeSpainSri LankaSt. Vincent and the GrenadinesSudanSwedenSwitzerlandSyriaTaiwanThailandTrinidad and TobagoTurkeyUgandaUkraineUruguayUzbekistanVenezuelaVietnamWest IndiesWestern AfricaWestern AsiaWestern EuropeYemenZaireZimbabweAzores
GED/Equivalency
Income
Poverty
Unemployment
Labor Participation
Family Structure
Vehicle Availability
Education Level
Disability

Bermudan GED/Equivalency
Average

85.8%
GED/EQUIVALENCY
55.1/ 100
METRIC RATING
172nd/ 347
METRIC RANK

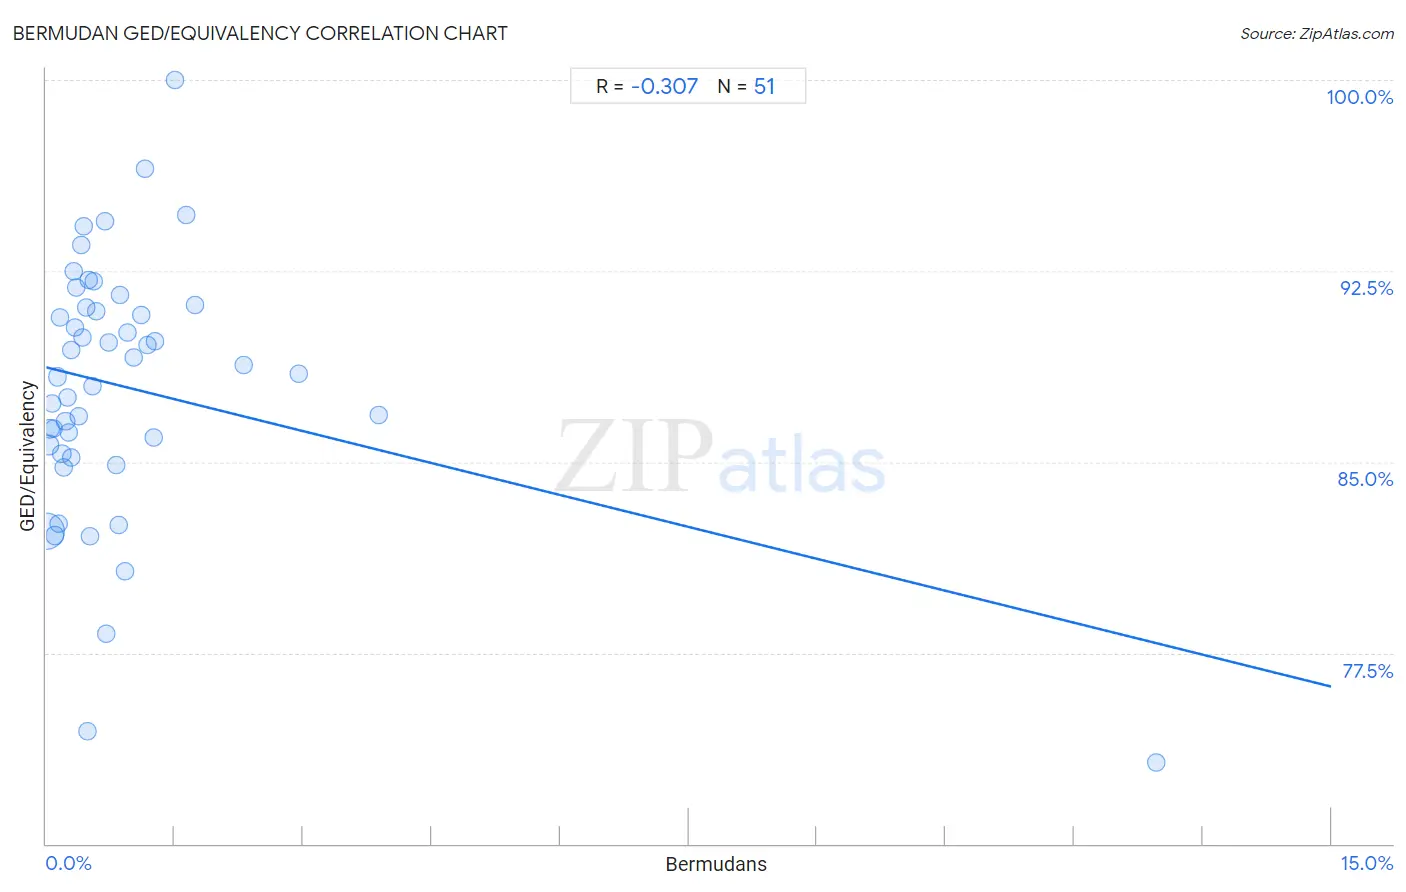
Bermudan GED/Equivalency Correlation Chart

The statistical analysis conducted on geographies consisting of 55,728,561 people shows a mild negative correlation between the proportion of Bermudans and percentage of population with at least ged/equivalency education in the United States with a correlation coefficient (R) of -0.307 and weighted average of 85.8%. On average, for every 1% (one percent) increase in Bermudans within a typical geography, there is a decrease of 0.84% in percentage of population with at least ged/equivalency education.
Bermudan GED/Equivalency
It is essential to understand that the correlation between the percentage of Bermudans and percentage of population with at least ged/equivalency education does not imply a direct cause-and-effect relationship. It remains uncertain whether the presence of Bermudans influences an upward or downward trend in the level of percentage of population with at least ged/equivalency education within an area, or if Bermudans simply ended up residing in those areas with higher or lower levels of percentage of population with at least ged/equivalency education due to other factors.

Demographics Similar to Bermudans by GED/Equivalency

In terms of ged/equivalency, the demographic groups most similar to Bermudans are Immigrants from Chile (85.9%, a difference of 0.050%), Immigrants from Venezuela (85.8%, a difference of 0.090%), Afghan (85.9%, a difference of 0.10%), Ottawa (85.8%, a difference of 0.10%), and Immigrants from Bolivia (85.8%, a difference of 0.11%).
DemographicsRating | RankGED/Equivalency
Alsatians
64.3
/100
|
#165
Good
86.0%
Immigrants from Albania
64.2
/100
|
#166
Good
86.0%
Ethiopians
63.7
/100
|
#167
Good
86.0%
Sierra Leoneans
61.8
/100
|
#168
Good
86.0%
Immigrants from Ethiopia
61.2
/100
|
#169
Good
86.0%
Afghans
59.7
/100
|
#170
Average
85.9%
Immigrants from Chile
57.3
/100
|
#171
Average
85.9%
Bermudans
55.1
/100
|
#172
Average
85.8%
Immigrants from Venezuela
50.7
/100
|
#173
Average
85.8%
Ottawa
50.0
/100
|
#174
Average
85.8%
Immigrants from Bolivia
49.8
/100
|
#175
Average
85.8%
Immigrants from Eastern Africa
47.7
/100
|
#176
Average
85.7%
Immigrants from Uganda
45.2
/100
|
#177
Average
85.7%
Koreans
41.2
/100
|
#178
Average
85.6%
Aleuts
40.5
/100
|
#179
Average
85.6%

Bermudan GED/Equivalency Correlation Summary

MeasurementBermudan DataGED/Equivalency Data
Minimum0.0057%73.2%
Maximum13.0%100.0%
Range13.0%26.8%
Mean0.97%87.9%
Median0.49%88.5%
Interquartile 25% (IQ1)0.25%85.3%
Interquartile 75% (IQ3)1.0%91.1%
Interquartile Range (IQR)0.77%5.8%
Standard Deviation (Sample)1.9%5.1%
Standard Deviation (Population)1.8%5.0%

Correlation Details

Bermudan PercentileSample SizeGED/Equivalency
[
0.0%
-
0.5%
]
0.0057%
42,083,12282.3%
[
0.0%
-
0.5%
]
0.027%
5,755,74585.6%
[
0.0%
-
0.5%
]
0.046%
2,608,68186.3%
[
0.0%
-
0.5%
]
0.067%
1,350,23087.3%
[
0.0%
-
0.5%
]
0.087%
886,56286.3%
[
0.0%
-
0.5%
]
0.11%
582,21182.1%
[
0.0%
-
0.5%
]
0.13%
180,20188.3%
[
0.0%
-
0.5%
]
0.15%
364,44682.6%
[
0.0%
-
0.5%
]
0.16%
196,46990.7%
[
0.0%
-
0.5%
]
0.18%
329,04185.3%
[
0.0%
-
0.5%
]
0.20%
212,77284.8%
[
0.0%
-
0.5%
]
0.23%
122,99386.6%
[
0.0%
-
0.5%
]
0.25%
59,22387.5%
[
0.0%
-
0.5%
]
0.26%
198,95986.1%
[
0.0%
-
0.5%
]
0.29%
82,84789.4%
[
0.0%
-
0.5%
]
0.30%
99,45985.2%
[
0.0%
-
0.5%
]
0.32%
29,91092.5%
[
0.0%
-
0.5%
]
0.34%
40,37390.3%
[
0.0%
-
0.5%
]
0.35%
73,99591.8%
[
0.0%
-
0.5%
]
0.38%
17,67186.8%
[
0.0%
-
0.5%
]
0.40%
23,33593.5%
[
0.0%
-
0.5%
]
0.42%
72,98989.9%
[
0.0%
-
0.5%
]
0.44%
3,21294.3%
[
0.0%
-
0.5%
]
0.46%
45,26991.1%
[
0.0%
-
0.5%
]
0.48%
33,52374.4%
[
0.0%
-
0.5%
]
0.49%
2,03992.1%
[
0.5%
-
1.0%
]
0.51%
7,64882.1%
[
0.5%
-
1.0%
]
0.54%
48,36188.0%
[
0.5%
-
1.0%
]
0.55%
62,89192.1%
[
0.5%
-
1.0%
]
0.59%
3,40690.9%
[
0.5%
-
1.0%
]
0.68%
2,05094.5%
[
0.5%
-
1.0%
]
0.70%
5,11578.2%
[
0.5%
-
1.0%
]
0.73%
2,73189.7%
[
0.5%
-
1.0%
]
0.82%
10,60284.9%
[
0.5%
-
1.0%
]
0.85%
51,93882.5%
[
0.5%
-
1.0%
]
0.86%
3,00691.6%
[
0.5%
-
1.0%
]
0.92%
5,33880.7%
[
0.5%
-
1.0%
]
0.95%
4,22190.1%
[
1.0%
-
1.5%
]
1.01%
24,55189.1%
[
1.0%
-
1.5%
]
1.12%
89690.8%
[
1.0%
-
1.5%
]
1.16%
9,76796.5%
[
1.0%
-
1.5%
]
1.18%
93289.6%
[
1.0%
-
1.5%
]
1.25%
8,00286.0%
[
1.0%
-
1.5%
]
1.27%
8,32689.7%
[
1.0%
-
1.5%
]
1.50%
468100.0%
[
1.5%
-
2.0%
]
1.64%
2,69094.7%
[
1.5%
-
2.0%
]
1.73%
17391.2%
[
2.0%
-
2.5%
]
2.31%
3,77088.8%
[
2.5%
-
3.0%
]
2.94%
37488.5%
[
3.5%
-
4.0%
]
3.89%
5,48086.9%
[
12.5%
-
13.0%
]
12.96%
54873.2%