Bermudan Disability Age Under 5
COMPARE
Bermudan
Select to Compare
Disability Age Under 5
Bermudan Disability Age Under 5
1.4%
DISABILITY | AGE UNDER 5
1.0/ 100
METRIC RATING
249th/ 347
METRIC RANK
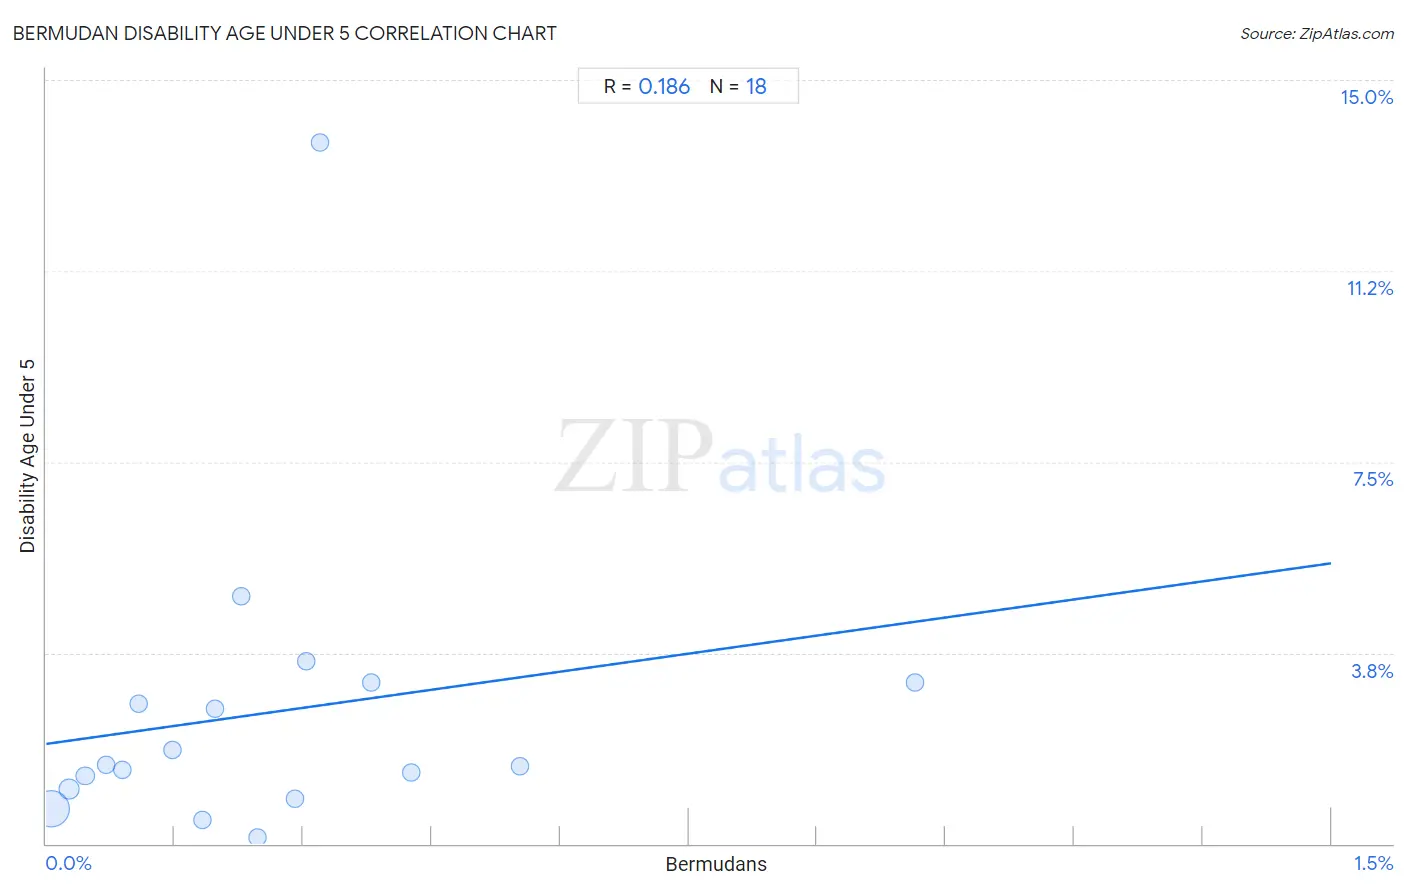
Bermudan Disability Age Under 5 Correlation Chart
The statistical analysis conducted on geographies consisting of 46,313,673 people shows a poor positive correlation between the proportion of Bermudans and percentage of population with a disability under the age of 5 in the United States with a correlation coefficient (R) of 0.186 and weighted average of 1.4%. On average, for every 1% (one percent) increase in Bermudans within a typical geography, there is an increase of 2.4% in percentage of population with a disability under the age of 5.
It is essential to understand that the correlation between the percentage of Bermudans and percentage of population with a disability under the age of 5 does not imply a direct cause-and-effect relationship. It remains uncertain whether the presence of Bermudans influences an upward or downward trend in the level of percentage of population with a disability under the age of 5 within an area, or if Bermudans simply ended up residing in those areas with higher or lower levels of percentage of population with a disability under the age of 5 due to other factors.
Demographics Similar to Bermudans by Disability Age Under 5
In terms of disability age under 5, the demographic groups most similar to Bermudans are African (1.4%, a difference of 0.010%), Immigrants from Hungary (1.4%, a difference of 0.040%), Eastern European (1.4%, a difference of 0.080%), Immigrants from Scotland (1.4%, a difference of 0.080%), and Immigrants from England (1.4%, a difference of 0.11%).
| Demographics | Rating | Rank | Disability Age Under 5 |
| Lumbee | 2.1 /100 | #242 | Tragic 1.3% |
| Immigrants from Cameroon | 1.7 /100 | #243 | Tragic 1.4% |
| Spaniards | 1.4 /100 | #244 | Tragic 1.4% |
| Potawatomi | 1.1 /100 | #245 | Tragic 1.4% |
| Russians | 1.0 /100 | #246 | Tragic 1.4% |
| Immigrants from England | 1.0 /100 | #247 | Tragic 1.4% |
| Eastern Europeans | 1.0 /100 | #248 | Tragic 1.4% |
| Bermudans | 1.0 /100 | #249 | Tragic 1.4% |
| Africans | 1.0 /100 | #250 | Tragic 1.4% |
| Immigrants from Hungary | 1.0 /100 | #251 | Tragic 1.4% |
| Immigrants from Scotland | 0.9 /100 | #252 | Tragic 1.4% |
| Australians | 0.7 /100 | #253 | Tragic 1.4% |
| Immigrants from Brazil | 0.7 /100 | #254 | Tragic 1.4% |
| Immigrants from Liberia | 0.6 /100 | #255 | Tragic 1.4% |
| Immigrants from Western Europe | 0.5 /100 | #256 | Tragic 1.4% |
Bermudan Disability Age Under 5 Correlation Summary
| Measurement | Bermudan Data | Disability Age Under 5 Data |
| Minimum | 0.0052% | 0.12% |
| Maximum | 1.0% | 13.8% |
| Range | 1.0% | 13.6% |
| Mean | 0.26% | 2.6% |
| Median | 0.21% | 1.5% |
| Interquartile 25% (IQ1) | 0.089% | 1.1% |
| Interquartile 75% (IQ3) | 0.32% | 3.2% |
| Interquartile Range (IQR) | 0.23% | 2.1% |
| Standard Deviation (Sample) | 0.24% | 3.1% |
| Standard Deviation (Population) | 0.23% | 3.0% |
Correlation Details
| Bermudan Percentile | Sample Size | Disability Age Under 5 |
[ 0.0% - 0.5% ] 0.0052% | 38,889,555 | 0.68% |
[ 0.0% - 0.5% ] 0.027% | 3,848,770 | 1.1% |
[ 0.0% - 0.5% ] 0.046% | 1,510,536 | 1.3% |
[ 0.0% - 0.5% ] 0.070% | 597,481 | 1.5% |
[ 0.0% - 0.5% ] 0.089% | 473,832 | 1.4% |
[ 0.0% - 0.5% ] 0.11% | 175,914 | 2.7% |
[ 0.0% - 0.5% ] 0.15% | 178,371 | 1.8% |
[ 0.0% - 0.5% ] 0.18% | 257,646 | 0.48% |
[ 0.0% - 0.5% ] 0.20% | 54,357 | 2.7% |
[ 0.0% - 0.5% ] 0.23% | 63,863 | 4.9% |
[ 0.0% - 0.5% ] 0.25% | 43,924 | 0.12% |
[ 0.0% - 0.5% ] 0.29% | 69,198 | 0.88% |
[ 0.0% - 0.5% ] 0.30% | 26,065 | 3.6% |
[ 0.0% - 0.5% ] 0.32% | 11,602 | 13.8% |
[ 0.0% - 0.5% ] 0.38% | 17,671 | 3.2% |
[ 0.0% - 0.5% ] 0.43% | 19,704 | 1.4% |
[ 0.5% - 1.0% ] 0.55% | 50,633 | 1.5% |
[ 1.0% - 1.5% ] 1.01% | 24,551 | 3.2% |