Bermudan 2 or more Vehicles in Household

COMPARE

Bermudan
Race
Ancestry
AfghanAfricanAlaska NativeAlaskan AthabascanAlbanianAleutAlsatianAmericanApacheArabArapahoArgentineanArmenianAssyrian/Chaldean/SyriacAustralianAustrianBahamianBangladeshiBarbadianBasqueBelgianBelizeanBermudanBhutaneseBlackfeetBolivianBrazilianBritishBritish West IndianBulgarianBurmeseCajunCambodianCanadianCape VerdeanCarpatho RusynCelticCentral AmericanCentral American IndianCherokeeCheyenneChickasawChileanChineseChippewaChoctawColombianColvilleComancheCosta RicanCreeCreekCroatianCrowCubanCypriotCzechCzechoslovakianDanishDelawareDominicanDutchDutch West IndianEastern EuropeanEcuadorianEgyptianEnglishEstonianEthiopianEuropeanFijianFilipinoFinnishFrenchFrench American IndianFrench CanadianGermanGerman RussianGhanaianGreekGuamanian/ChamorroGuatemalanGuyaneseHaitianHmongHonduranHopiHoumaHungarianIcelanderIndian (Asian)IndonesianInupiatIranianIraqiIrishIroquoisIsraeliItalianJamaicanJapaneseJordanianKenyanKiowaKoreanLaotianLatvianLebaneseLiberianLithuanianLumbeeLuxembourgerMacedonianMalaysianMalteseMarshalleseMenomineeMexicanMexican American IndianMongolianMoroccanNative HawaiianNavajoNepaleseNew ZealanderNicaraguanNigerianNorthern EuropeanNorwegianOkinawanOsageOttawaPaiutePakistaniPalestinianPanamanianParaguayanPennsylvania GermanPeruvianPimaPolishPortuguesePotawatomiPuebloPuerto RicanPuget Sound SalishRomanianRussianSalvadoranSamoanScandinavianScotch-IrishScottishSeminoleSenegaleseSerbianShoshoneSierra LeoneanSiouxSlavicSlovakSloveneSomaliSouth AfricanSouth AmericanSouth American IndianSoviet UnionSpaniardSpanishSpanish AmericanSpanish American IndianSri LankanSubsaharan AfricanSudaneseSwedishSwissSyrianTaiwaneseThaiTlingit-HaidaTohono O'OdhamTonganTrinidadian and TobagonianTsimshianTurkishU.S. Virgin IslanderUgandanUkrainianUruguayanUteVenezuelanVietnameseWelshWest IndianYakamaYaquiYugoslavianYumanYup'ikZimbabwean
Immigration
NonimmigrantsImmigrantsAfghanistanAfricaAlbaniaArgentinaArmeniaAsiaAustraliaAustriaBahamasBangladeshBarbadosBelarusBelgiumBelizeBoliviaBosnia and HerzegovinaBrazilBulgariaBurma/MyanmarCabo VerdeCambodiaCameroonCanadaCaribbeanCentral AmericaChileChinaColombiaCongoCosta RicaCroatiaCubaCzechoslovakiaDenmarkDominicaDominican RepublicEastern AfricaEastern AsiaEastern EuropeEcuadorEgyptEl SalvadorEnglandEritreaEthiopiaEuropeFijiFranceGermanyGhanaGreeceGrenadaGuatemalaGuyanaHaitiHondurasHong KongHungaryIndiaIndonesiaIranIraqIrelandIsraelItalyJamaicaJapanJordanKazakhstanKenyaKoreaKuwaitLaosLatin AmericaLatviaLebanonLiberiaLithuaniaMalaysiaMexicoMicronesiaMiddle AfricaMoldovaMoroccoNepalNetherlandsNicaraguaNigeriaNorth AmericaNorth MacedoniaNorthern AfricaNorthern EuropeNorwayOceaniaPakistanPanamaPeruPhilippinesPolandPortugalRomaniaRussiaSaudi ArabiaScotlandSenegalSerbiaSierra LeoneSingaporeSomaliaSouth AfricaSouth AmericaSouth Central AsiaSouth Eastern AsiaSouthern EuropeSpainSri LankaSt. Vincent and the GrenadinesSudanSwedenSwitzerlandSyriaTaiwanThailandTrinidad and TobagoTurkeyUgandaUkraineUruguayUzbekistanVenezuelaVietnamWest IndiesWestern AfricaWestern AsiaWestern EuropeYemenZaireZimbabweAzores
Select to Compare
Race
Ancestry
AfghanAfricanAlaska NativeAlaskan AthabascanAlbanianAleutAlsatianAmericanApacheArabArapahoArgentineanArmenianAssyrian/Chaldean/SyriacAustralianAustrianBahamianBangladeshiBarbadianBasqueBelgianBelizeanBhutaneseBlackfeetBolivianBrazilianBritishBritish West IndianBulgarianBurmeseCajunCambodianCanadianCape VerdeanCarpatho RusynCelticCentral AmericanCentral American IndianCherokeeCheyenneChickasawChileanChineseChippewaChoctawColombianColvilleComancheCosta RicanCreeCreekCroatianCrowCubanCypriotCzechCzechoslovakianDanishDelawareDominicanDutchDutch West IndianEastern EuropeanEcuadorianEgyptianEnglishEstonianEthiopianEuropeanFijianFilipinoFinnishFrenchFrench American IndianFrench CanadianGermanGerman RussianGhanaianGreekGuamanian/ChamorroGuatemalanGuyaneseHaitianHmongHonduranHopiHoumaHungarianIcelanderIndian (Asian)IndonesianInupiatIranianIraqiIrishIroquoisIsraeliItalianJamaicanJapaneseJordanianKenyanKiowaKoreanLaotianLatvianLebaneseLiberianLithuanianLumbeeLuxembourgerMacedonianMalaysianMalteseMarshalleseMenomineeMexicanMexican American IndianMongolianMoroccanNative HawaiianNavajoNepaleseNew ZealanderNicaraguanNigerianNorthern EuropeanNorwegianOkinawanOsageOttawaPaiutePakistaniPalestinianPanamanianParaguayanPennsylvania GermanPeruvianPimaPolishPortuguesePotawatomiPuebloPuerto RicanPuget Sound SalishRomanianRussianSalvadoranSamoanScandinavianScotch-IrishScottishSeminoleSenegaleseSerbianShoshoneSierra LeoneanSiouxSlavicSlovakSloveneSomaliSouth AfricanSouth AmericanSouth American IndianSoviet UnionSpaniardSpanishSpanish AmericanSpanish American IndianSri LankanSubsaharan AfricanSudaneseSwedishSwissSyrianTaiwaneseThaiTlingit-HaidaTohono O'OdhamTonganTrinidadian and TobagonianTsimshianTurkishU.S. Virgin IslanderUgandanUkrainianUruguayanUteVenezuelanVietnameseWelshWest IndianYakamaYaquiYugoslavianYumanYup'ikZimbabwean
Immigration
NonimmigrantsImmigrantsAfghanistanAfricaAlbaniaArgentinaArmeniaAsiaAustraliaAustriaBahamasBangladeshBarbadosBelarusBelgiumBelizeBoliviaBosnia and HerzegovinaBrazilBulgariaBurma/MyanmarCabo VerdeCambodiaCameroonCanadaCaribbeanCentral AmericaChileChinaColombiaCongoCosta RicaCroatiaCubaCzechoslovakiaDenmarkDominicaDominican RepublicEastern AfricaEastern AsiaEastern EuropeEcuadorEgyptEl SalvadorEnglandEritreaEthiopiaEuropeFijiFranceGermanyGhanaGreeceGrenadaGuatemalaGuyanaHaitiHondurasHong KongHungaryIndiaIndonesiaIranIraqIrelandIsraelItalyJamaicaJapanJordanKazakhstanKenyaKoreaKuwaitLaosLatin AmericaLatviaLebanonLiberiaLithuaniaMalaysiaMexicoMicronesiaMiddle AfricaMoldovaMoroccoNepalNetherlandsNicaraguaNigeriaNorth AmericaNorth MacedoniaNorthern AfricaNorthern EuropeNorwayOceaniaPakistanPanamaPeruPhilippinesPolandPortugalRomaniaRussiaSaudi ArabiaScotlandSenegalSerbiaSierra LeoneSingaporeSomaliaSouth AfricaSouth AmericaSouth Central AsiaSouth Eastern AsiaSouthern EuropeSpainSri LankaSt. Vincent and the GrenadinesSudanSwedenSwitzerlandSyriaTaiwanThailandTrinidad and TobagoTurkeyUgandaUkraineUruguayUzbekistanVenezuelaVietnamWest IndiesWestern AfricaWestern AsiaWestern EuropeYemenZaireZimbabweAzores
2 or more Vehicles in Household
Income
Poverty
Unemployment
Labor Participation
Family Structure
Vehicle Availability
Education Level
Disability

Bermudan 2 or more Vehicles in Household
Tragic

50.6%
2+ VEHICLES AVAILABLE
0.0/ 100
METRIC RATING
294th/ 347
METRIC RANK

Bermudan 2 or more Vehicles in Household Correlation Chart

The statistical analysis conducted on geographies consisting of 55,716,623 people shows a mild positive correlation between the proportion of Bermudans and percentage of households with 2 or more vehicles available in the United States with a correlation coefficient (R) of 0.395 and weighted average of 50.6%. On average, for every 1% (one percent) increase in Bermudans within a typical geography, there is an increase of 3.2% in percentage of households with 2 or more vehicles available.
Bermudan 2 or more Vehicles in Household
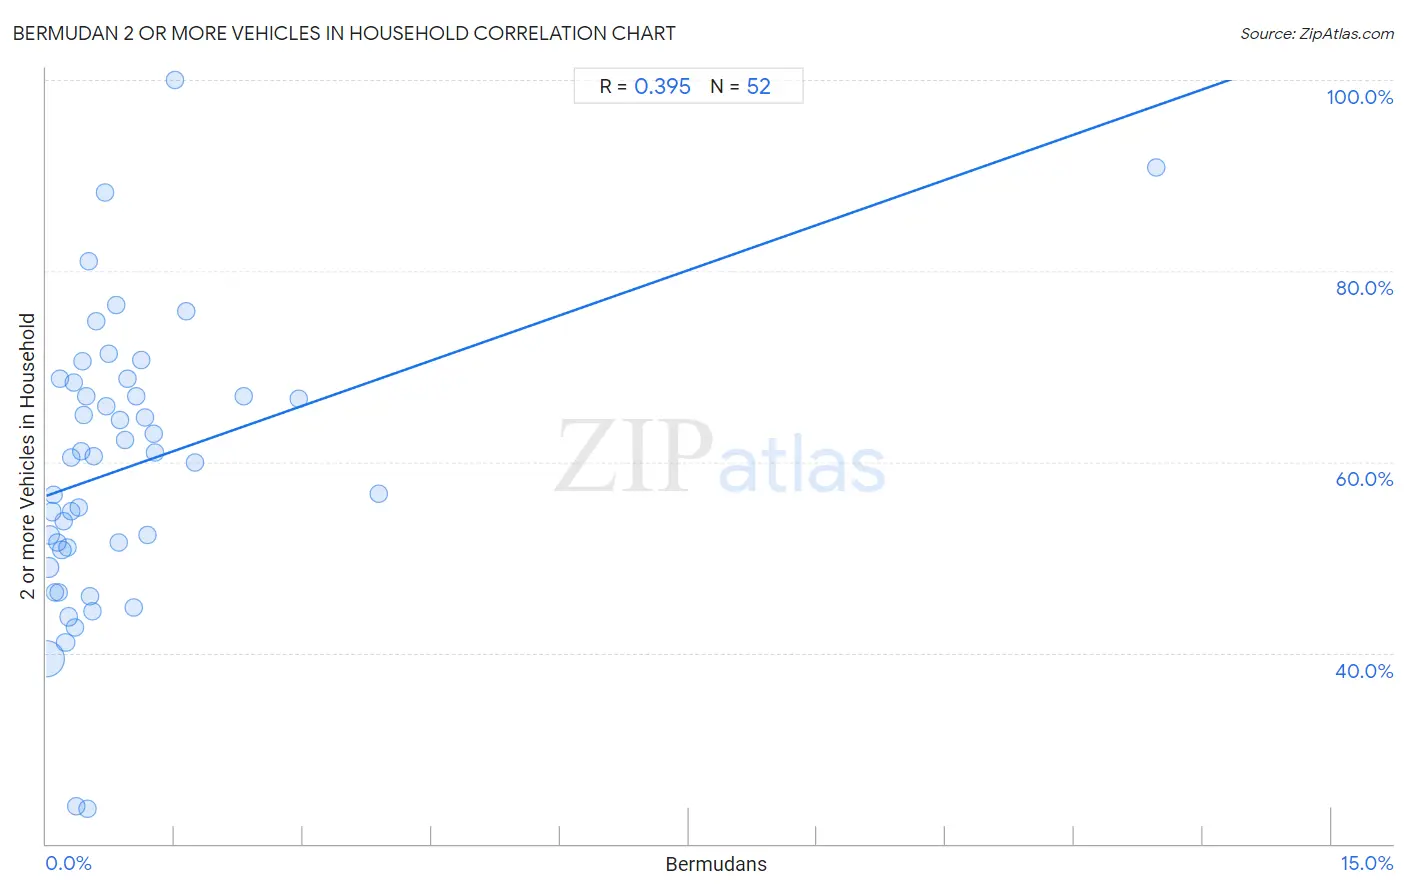
It is essential to understand that the correlation between the percentage of Bermudans and percentage of households with 2 or more vehicles available does not imply a direct cause-and-effect relationship. It remains uncertain whether the presence of Bermudans influences an upward or downward trend in the level of percentage of households with 2 or more vehicles available within an area, or if Bermudans simply ended up residing in those areas with higher or lower levels of percentage of households with 2 or more vehicles available due to other factors.

Demographics Similar to Bermudans by 2 or more Vehicles in Household

In terms of 2 or more vehicles in household, the demographic groups most similar to Bermudans are Cypriot (50.6%, a difference of 0.070%), Immigrants from Somalia (50.5%, a difference of 0.11%), Immigrants from Spain (50.4%, a difference of 0.38%), Paraguayan (50.3%, a difference of 0.51%), and Immigrants from Morocco (50.3%, a difference of 0.54%).
DemographicsRating | Rank2 or more Vehicles in Household
Immigrants from Serbia
0.1
/100
|
#287
Tragic
51.3%
Okinawans
0.1
/100
|
#288
Tragic
51.2%
Somalis
0.0
/100
|
#289
Tragic
51.1%
Immigrants from Panama
0.0
/100
|
#290
Tragic
51.1%
Belizeans
0.0
/100
|
#291
Tragic
51.0%
Immigrants from Ukraine
0.0
/100
|
#292
Tragic
50.9%
Blacks/African Americans
0.0
/100
|
#293
Tragic
50.9%
Bermudans
0.0
/100
|
#294
Tragic
50.6%
Cypriots
0.0
/100
|
#295
Tragic
50.6%
Immigrants from Somalia
0.0
/100
|
#296
Tragic
50.5%
Immigrants from Spain
0.0
/100
|
#297
Tragic
50.4%
Paraguayans
0.0
/100
|
#298
Tragic
50.3%
Immigrants from Morocco
0.0
/100
|
#299
Tragic
50.3%
Immigrants from Russia
0.0
/100
|
#300
Tragic
50.3%
Immigrants from Greece
0.0
/100
|
#301
Tragic
50.2%

Bermudan 2 or more Vehicles in Household Correlation Summary

MeasurementBermudan Data2 or more Vehicles in Household Data
Minimum0.0057%23.7%
Maximum13.0%100.0%
Range13.0%76.3%
Mean0.97%59.5%
Median0.50%60.5%
Interquartile 25% (IQ1)0.25%50.9%
Interquartile 75% (IQ3)1.0%67.6%
Interquartile Range (IQR)0.78%16.8%
Standard Deviation (Sample)1.8%14.7%
Standard Deviation (Population)1.8%14.6%

Correlation Details

Bermudan PercentileSample Size2 or more Vehicles in Household
[
0.0%
-
0.5%
]
0.0057%
42,083,12239.3%
[
0.0%
-
0.5%
]
0.027%
5,755,74548.9%
[
0.0%
-
0.5%
]
0.046%
2,608,68152.3%
[
0.0%
-
0.5%
]
0.067%
1,350,23054.8%
[
0.0%
-
0.5%
]
0.087%
877,73256.5%
[
0.0%
-
0.5%
]
0.11%
582,21146.4%
[
0.0%
-
0.5%
]
0.13%
180,20151.5%
[
0.0%
-
0.5%
]
0.15%
364,44646.3%
[
0.0%
-
0.5%
]
0.16%
196,46968.7%
[
0.0%
-
0.5%
]
0.18%
329,04150.7%
[
0.0%
-
0.5%
]
0.20%
212,77253.8%
[
0.0%
-
0.5%
]
0.23%
122,99341.1%
[
0.0%
-
0.5%
]
0.25%
59,22351.0%
[
0.0%
-
0.5%
]
0.26%
194,03343.8%
[
0.0%
-
0.5%
]
0.29%
82,84760.5%
[
0.0%
-
0.5%
]
0.30%
99,45954.9%
[
0.0%
-
0.5%
]
0.32%
29,91068.3%
[
0.0%
-
0.5%
]
0.34%
40,37342.7%
[
0.0%
-
0.5%
]
0.35%
73,99523.9%
[
0.0%
-
0.5%
]
0.38%
17,67155.2%
[
0.0%
-
0.5%
]
0.40%
23,33561.1%
[
0.0%
-
0.5%
]
0.42%
72,98970.6%
[
0.0%
-
0.5%
]
0.44%
3,21264.9%
[
0.0%
-
0.5%
]
0.46%
45,26966.9%
[
0.0%
-
0.5%
]
0.48%
33,52323.7%
[
0.0%
-
0.5%
]
0.49%
2,03981.1%
[
0.5%
-
1.0%
]
0.51%
7,64845.9%
[
0.5%
-
1.0%
]
0.54%
48,36144.4%
[
0.5%
-
1.0%
]
0.55%
62,89160.6%
[
0.5%
-
1.0%
]
0.59%
3,40674.7%
[
0.5%
-
1.0%
]
0.68%
2,05088.3%
[
0.5%
-
1.0%
]
0.70%
5,11565.8%
[
0.5%
-
1.0%
]
0.73%
2,73171.4%
[
0.5%
-
1.0%
]
0.82%
10,60276.4%
[
0.5%
-
1.0%
]
0.85%
51,93851.5%
[
0.5%
-
1.0%
]
0.86%
3,00664.4%
[
0.5%
-
1.0%
]
0.92%
5,33862.3%
[
0.5%
-
1.0%
]
0.95%
4,22168.7%
[
1.0%
-
1.5%
]
1.01%
24,55144.8%
[
1.0%
-
1.5%
]
1.05%
1,81866.8%
[
1.0%
-
1.5%
]
1.12%
89670.7%
[
1.0%
-
1.5%
]
1.16%
9,76764.7%
[
1.0%
-
1.5%
]
1.18%
93252.3%
[
1.0%
-
1.5%
]
1.25%
8,00263.0%
[
1.0%
-
1.5%
]
1.27%
8,32661.0%
[
1.0%
-
1.5%
]
1.50%
468100.0%
[
1.5%
-
2.0%
]
1.64%
2,69075.7%
[
1.5%
-
2.0%
]
1.73%
17360.0%
[
2.0%
-
2.5%
]
2.31%
3,77066.9%
[
2.5%
-
3.0%
]
2.94%
37466.7%
[
3.5%
-
4.0%
]
3.89%
5,48056.7%
[
12.5%
-
13.0%
]
12.96%
54890.8%