Bermudan Unemployment Among Women with Children Ages 6 to 17 years
COMPARE
Bermudan
Select to Compare
Unemployment Among Women with Children Ages 6 to 17 years
Bermudan Unemployment Among Women with Children Ages 6 to 17 years
10.5%
UNEMPLOYMENT | WOMEN W/ CHILDREN 6 TO 17
0.0/ 100
METRIC RATING
317th/ 347
METRIC RANK
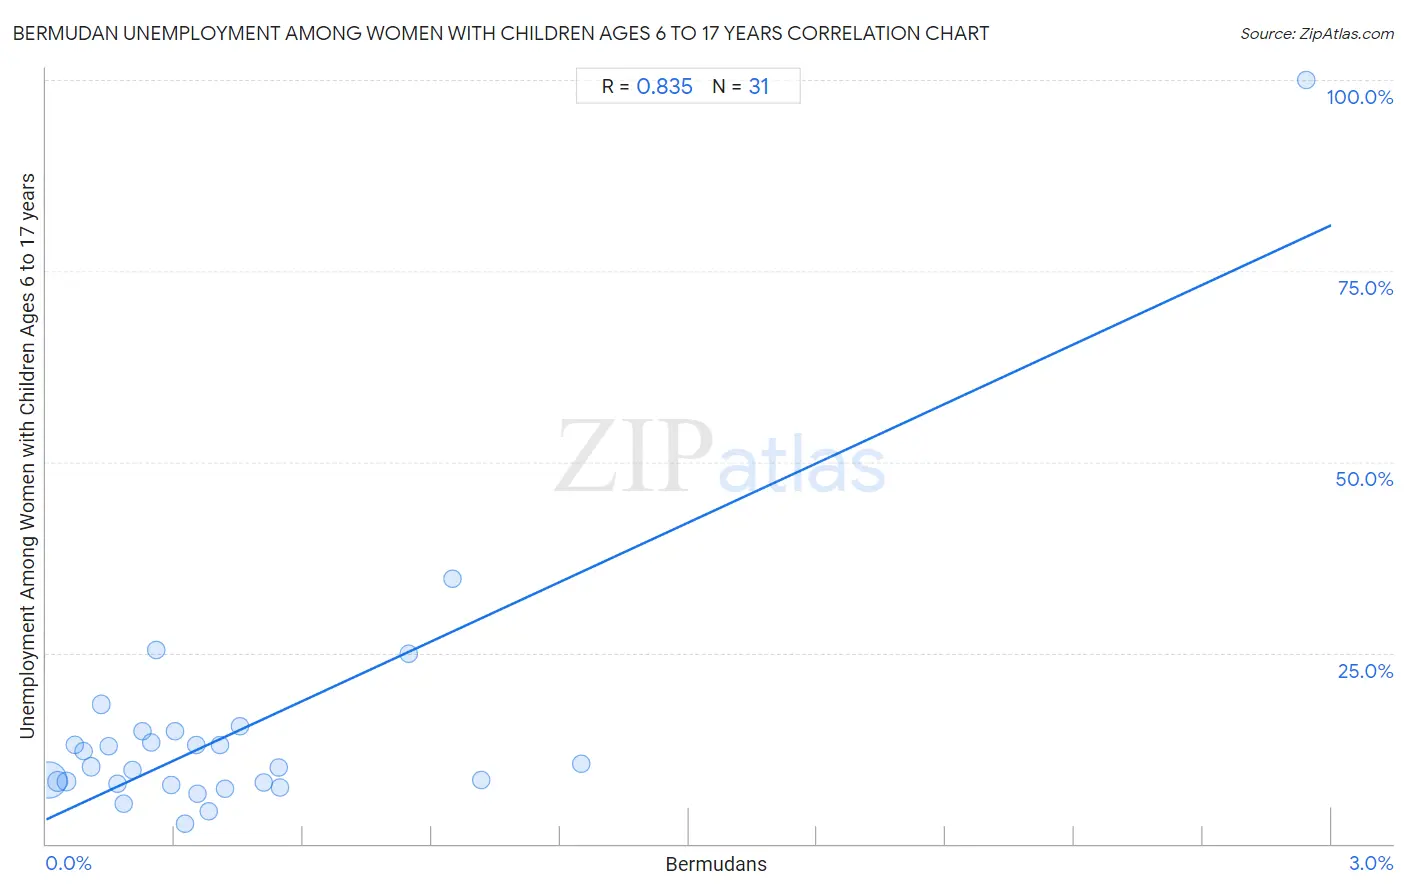
Bermudan Unemployment Among Women with Children Ages 6 to 17 years Correlation Chart
The statistical analysis conducted on geographies consisting of 51,078,380 people shows a very strong positive correlation between the proportion of Bermudans and unemployment rate among women with children between the ages 6 and 17 in the United States with a correlation coefficient (R) of 0.835 and weighted average of 10.5%. On average, for every 1% (one percent) increase in Bermudans within a typical geography, there is an increase of 25.9% in unemployment rate among women with children between the ages 6 and 17.
It is essential to understand that the correlation between the percentage of Bermudans and unemployment rate among women with children between the ages 6 and 17 does not imply a direct cause-and-effect relationship. It remains uncertain whether the presence of Bermudans influences an upward or downward trend in the level of unemployment rate among women with children between the ages 6 and 17 within an area, or if Bermudans simply ended up residing in those areas with higher or lower levels of unemployment rate among women with children between the ages 6 and 17 due to other factors.
Demographics Similar to Bermudans by Unemployment Among Women with Children Ages 6 to 17 years
In terms of unemployment among women with children ages 6 to 17 years, the demographic groups most similar to Bermudans are Delaware (10.5%, a difference of 0.020%), Immigrants from Dominica (10.5%, a difference of 0.12%), Bahamian (10.4%, a difference of 0.87%), Immigrants from Cabo Verde (10.4%, a difference of 0.89%), and American (10.4%, a difference of 0.94%).
| Demographics | Rating | Rank | Unemployment Among Women with Children Ages 6 to 17 years |
| Alaska Natives | 0.0 /100 | #310 | Tragic 10.3% |
| Immigrants from Liberia | 0.0 /100 | #311 | Tragic 10.3% |
| Africans | 0.0 /100 | #312 | Tragic 10.4% |
| Americans | 0.0 /100 | #313 | Tragic 10.4% |
| Immigrants from Cabo Verde | 0.0 /100 | #314 | Tragic 10.4% |
| Bahamians | 0.0 /100 | #315 | Tragic 10.4% |
| Immigrants from Dominica | 0.0 /100 | #316 | Tragic 10.5% |
| Bermudans | 0.0 /100 | #317 | Tragic 10.5% |
| Delaware | 0.0 /100 | #318 | Tragic 10.5% |
| Immigrants from Uganda | 0.0 /100 | #319 | Tragic 10.7% |
| Apache | 0.0 /100 | #320 | Tragic 10.7% |
| Tohono O'odham | 0.0 /100 | #321 | Tragic 10.7% |
| Cree | 0.0 /100 | #322 | Tragic 10.8% |
| Dominicans | 0.0 /100 | #323 | Tragic 10.8% |
| Immigrants from Dominican Republic | 0.0 /100 | #324 | Tragic 10.8% |
Bermudan Unemployment Among Women with Children Ages 6 to 17 years Correlation Summary
| Measurement | Bermudan Data | Unemployment Among Women with Children Ages 6 to 17 years Data |
| Minimum | 0.0056% | 2.7% |
| Maximum | 2.9% | 100.0% |
| Range | 2.9% | 97.3% |
| Mean | 0.44% | 14.7% |
| Median | 0.30% | 10.1% |
| Interquartile 25% (IQ1) | 0.15% | 7.9% |
| Interquartile 75% (IQ3) | 0.51% | 14.7% |
| Interquartile Range (IQR) | 0.36% | 6.9% |
| Standard Deviation (Sample) | 0.55% | 17.2% |
| Standard Deviation (Population) | 0.54% | 16.9% |
Correlation Details
| Bermudan Percentile | Sample Size | Unemployment Among Women with Children Ages 6 to 17 years |
[ 0.0% - 0.5% ] 0.0056% | 41,473,595 | 8.4% |
[ 0.0% - 0.5% ] 0.027% | 4,690,232 | 8.1% |
[ 0.0% - 0.5% ] 0.047% | 1,658,653 | 8.1% |
[ 0.0% - 0.5% ] 0.066% | 739,373 | 13.0% |
[ 0.0% - 0.5% ] 0.087% | 632,561 | 12.1% |
[ 0.0% - 0.5% ] 0.11% | 480,632 | 10.1% |
[ 0.0% - 0.5% ] 0.13% | 102,061 | 18.2% |
[ 0.0% - 0.5% ] 0.15% | 257,547 | 12.7% |
[ 0.0% - 0.5% ] 0.17% | 101,793 | 7.9% |
[ 0.0% - 0.5% ] 0.18% | 264,464 | 5.3% |
[ 0.0% - 0.5% ] 0.20% | 120,464 | 9.7% |
[ 0.0% - 0.5% ] 0.23% | 77,560 | 14.8% |
[ 0.0% - 0.5% ] 0.25% | 43,924 | 13.2% |
[ 0.0% - 0.5% ] 0.26% | 51,151 | 25.4% |
[ 0.0% - 0.5% ] 0.29% | 69,198 | 7.8% |
[ 0.0% - 0.5% ] 0.30% | 45,620 | 14.7% |
[ 0.0% - 0.5% ] 0.32% | 8,371 | 2.7% |
[ 0.0% - 0.5% ] 0.35% | 8,588 | 12.9% |
[ 0.0% - 0.5% ] 0.35% | 27,426 | 6.6% |
[ 0.0% - 0.5% ] 0.38% | 17,671 | 4.3% |
[ 0.0% - 0.5% ] 0.41% | 10,078 | 12.9% |
[ 0.0% - 0.5% ] 0.42% | 35,313 | 7.1% |
[ 0.0% - 0.5% ] 0.45% | 9,086 | 15.4% |
[ 0.5% - 1.0% ] 0.51% | 5,897 | 8.1% |
[ 0.5% - 1.0% ] 0.54% | 45,772 | 10.0% |
[ 0.5% - 1.0% ] 0.55% | 12,264 | 7.3% |
[ 0.5% - 1.0% ] 0.85% | 51,938 | 24.9% |
[ 0.5% - 1.0% ] 0.95% | 4,221 | 34.7% |
[ 1.0% - 1.5% ] 1.01% | 24,551 | 8.4% |
[ 1.0% - 1.5% ] 1.25% | 8,002 | 10.5% |
[ 2.5% - 3.0% ] 2.94% | 374 | 100.0% |