Bermudan 1 or more Vehicles in Household

COMPARE

Bermudan
Race
Ancestry
AfghanAfricanAlaska NativeAlaskan AthabascanAlbanianAleutAlsatianAmericanApacheArabArapahoArgentineanArmenianAssyrian/Chaldean/SyriacAustralianAustrianBahamianBangladeshiBarbadianBasqueBelgianBelizeanBermudanBhutaneseBlackfeetBolivianBrazilianBritishBritish West IndianBulgarianBurmeseCajunCambodianCanadianCape VerdeanCarpatho RusynCelticCentral AmericanCentral American IndianCherokeeCheyenneChickasawChileanChineseChippewaChoctawColombianColvilleComancheCosta RicanCreeCreekCroatianCrowCubanCypriotCzechCzechoslovakianDanishDelawareDominicanDutchDutch West IndianEastern EuropeanEcuadorianEgyptianEnglishEstonianEthiopianEuropeanFijianFilipinoFinnishFrenchFrench American IndianFrench CanadianGermanGerman RussianGhanaianGreekGuamanian/ChamorroGuatemalanGuyaneseHaitianHmongHonduranHopiHoumaHungarianIcelanderIndian (Asian)IndonesianInupiatIranianIraqiIrishIroquoisIsraeliItalianJamaicanJapaneseJordanianKenyanKiowaKoreanLaotianLatvianLebaneseLiberianLithuanianLumbeeLuxembourgerMacedonianMalaysianMalteseMarshalleseMenomineeMexicanMexican American IndianMongolianMoroccanNative HawaiianNavajoNepaleseNew ZealanderNicaraguanNigerianNorthern EuropeanNorwegianOkinawanOsageOttawaPaiutePakistaniPalestinianPanamanianParaguayanPennsylvania GermanPeruvianPimaPolishPortuguesePotawatomiPuebloPuerto RicanPuget Sound SalishRomanianRussianSalvadoranSamoanScandinavianScotch-IrishScottishSeminoleSenegaleseSerbianShoshoneSierra LeoneanSiouxSlavicSlovakSloveneSomaliSouth AfricanSouth AmericanSouth American IndianSoviet UnionSpaniardSpanishSpanish AmericanSpanish American IndianSri LankanSubsaharan AfricanSudaneseSwedishSwissSyrianTaiwaneseThaiTlingit-HaidaTohono O'OdhamTonganTrinidadian and TobagonianTsimshianTurkishU.S. Virgin IslanderUgandanUkrainianUruguayanUteVenezuelanVietnameseWelshWest IndianYakamaYaquiYugoslavianYumanYup'ikZimbabwean
Immigration
NonimmigrantsImmigrantsAfghanistanAfricaAlbaniaArgentinaArmeniaAsiaAustraliaAustriaBahamasBangladeshBarbadosBelarusBelgiumBelizeBoliviaBosnia and HerzegovinaBrazilBulgariaBurma/MyanmarCabo VerdeCambodiaCameroonCanadaCaribbeanCentral AmericaChileChinaColombiaCongoCosta RicaCroatiaCubaCzechoslovakiaDenmarkDominicaDominican RepublicEastern AfricaEastern AsiaEastern EuropeEcuadorEgyptEl SalvadorEnglandEritreaEthiopiaEuropeFijiFranceGermanyGhanaGreeceGrenadaGuatemalaGuyanaHaitiHondurasHong KongHungaryIndiaIndonesiaIranIraqIrelandIsraelItalyJamaicaJapanJordanKazakhstanKenyaKoreaKuwaitLaosLatin AmericaLatviaLebanonLiberiaLithuaniaMalaysiaMexicoMicronesiaMiddle AfricaMoldovaMoroccoNepalNetherlandsNicaraguaNigeriaNorth AmericaNorth MacedoniaNorthern AfricaNorthern EuropeNorwayOceaniaPakistanPanamaPeruPhilippinesPolandPortugalRomaniaRussiaSaudi ArabiaScotlandSenegalSerbiaSierra LeoneSingaporeSomaliaSouth AfricaSouth AmericaSouth Central AsiaSouth Eastern AsiaSouthern EuropeSpainSri LankaSt. Vincent and the GrenadinesSudanSwedenSwitzerlandSyriaTaiwanThailandTrinidad and TobagoTurkeyUgandaUkraineUruguayUzbekistanVenezuelaVietnamWest IndiesWestern AfricaWestern AsiaWestern EuropeYemenZaireZimbabweAzores
Select to Compare
Race
Ancestry
AfghanAfricanAlaska NativeAlaskan AthabascanAlbanianAleutAlsatianAmericanApacheArabArapahoArgentineanArmenianAssyrian/Chaldean/SyriacAustralianAustrianBahamianBangladeshiBarbadianBasqueBelgianBelizeanBhutaneseBlackfeetBolivianBrazilianBritishBritish West IndianBulgarianBurmeseCajunCambodianCanadianCape VerdeanCarpatho RusynCelticCentral AmericanCentral American IndianCherokeeCheyenneChickasawChileanChineseChippewaChoctawColombianColvilleComancheCosta RicanCreeCreekCroatianCrowCubanCypriotCzechCzechoslovakianDanishDelawareDominicanDutchDutch West IndianEastern EuropeanEcuadorianEgyptianEnglishEstonianEthiopianEuropeanFijianFilipinoFinnishFrenchFrench American IndianFrench CanadianGermanGerman RussianGhanaianGreekGuamanian/ChamorroGuatemalanGuyaneseHaitianHmongHonduranHopiHoumaHungarianIcelanderIndian (Asian)IndonesianInupiatIranianIraqiIrishIroquoisIsraeliItalianJamaicanJapaneseJordanianKenyanKiowaKoreanLaotianLatvianLebaneseLiberianLithuanianLumbeeLuxembourgerMacedonianMalaysianMalteseMarshalleseMenomineeMexicanMexican American IndianMongolianMoroccanNative HawaiianNavajoNepaleseNew ZealanderNicaraguanNigerianNorthern EuropeanNorwegianOkinawanOsageOttawaPaiutePakistaniPalestinianPanamanianParaguayanPennsylvania GermanPeruvianPimaPolishPortuguesePotawatomiPuebloPuerto RicanPuget Sound SalishRomanianRussianSalvadoranSamoanScandinavianScotch-IrishScottishSeminoleSenegaleseSerbianShoshoneSierra LeoneanSiouxSlavicSlovakSloveneSomaliSouth AfricanSouth AmericanSouth American IndianSoviet UnionSpaniardSpanishSpanish AmericanSpanish American IndianSri LankanSubsaharan AfricanSudaneseSwedishSwissSyrianTaiwaneseThaiTlingit-HaidaTohono O'OdhamTonganTrinidadian and TobagonianTsimshianTurkishU.S. Virgin IslanderUgandanUkrainianUruguayanUteVenezuelanVietnameseWelshWest IndianYakamaYaquiYugoslavianYumanYup'ikZimbabwean
Immigration
NonimmigrantsImmigrantsAfghanistanAfricaAlbaniaArgentinaArmeniaAsiaAustraliaAustriaBahamasBangladeshBarbadosBelarusBelgiumBelizeBoliviaBosnia and HerzegovinaBrazilBulgariaBurma/MyanmarCabo VerdeCambodiaCameroonCanadaCaribbeanCentral AmericaChileChinaColombiaCongoCosta RicaCroatiaCubaCzechoslovakiaDenmarkDominicaDominican RepublicEastern AfricaEastern AsiaEastern EuropeEcuadorEgyptEl SalvadorEnglandEritreaEthiopiaEuropeFijiFranceGermanyGhanaGreeceGrenadaGuatemalaGuyanaHaitiHondurasHong KongHungaryIndiaIndonesiaIranIraqIrelandIsraelItalyJamaicaJapanJordanKazakhstanKenyaKoreaKuwaitLaosLatin AmericaLatviaLebanonLiberiaLithuaniaMalaysiaMexicoMicronesiaMiddle AfricaMoldovaMoroccoNepalNetherlandsNicaraguaNigeriaNorth AmericaNorth MacedoniaNorthern AfricaNorthern EuropeNorwayOceaniaPakistanPanamaPeruPhilippinesPolandPortugalRomaniaRussiaSaudi ArabiaScotlandSenegalSerbiaSierra LeoneSingaporeSomaliaSouth AfricaSouth AmericaSouth Central AsiaSouth Eastern AsiaSouthern EuropeSpainSri LankaSt. Vincent and the GrenadinesSudanSwedenSwitzerlandSyriaTaiwanThailandTrinidad and TobagoTurkeyUgandaUkraineUruguayUzbekistanVenezuelaVietnamWest IndiesWestern AfricaWestern AsiaWestern EuropeYemenZaireZimbabweAzores
1 or more Vehicles in Household
Income
Poverty
Unemployment
Labor Participation
Family Structure
Vehicle Availability
Education Level
Disability

Bermudan 1 or more Vehicles in Household
Tragic

87.5%
1+ VEHICLES AVAILABLE
0.2/ 100
METRIC RATING
271st/ 347
METRIC RANK

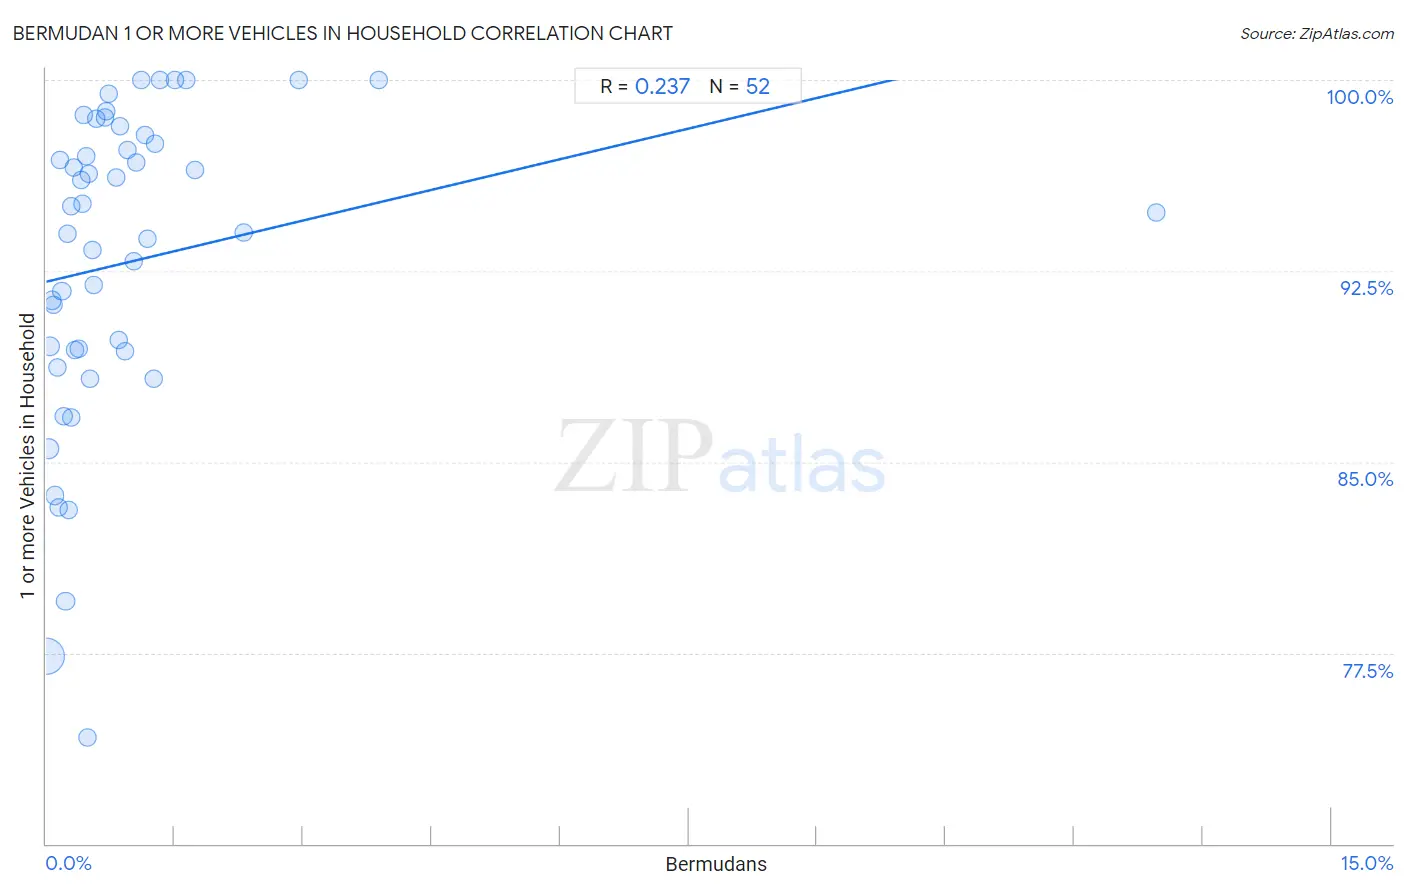
Bermudan 1 or more Vehicles in Household Correlation Chart

The statistical analysis conducted on geographies consisting of 55,645,042 people shows a weak positive correlation between the proportion of Bermudans and percentage of households with 1 or more vehicles available in the United States with a correlation coefficient (R) of 0.237 and weighted average of 87.5%. On average, for every 1% (one percent) increase in Bermudans within a typical geography, there is an increase of 0.80% in percentage of households with 1 or more vehicles available.
Bermudan 1 or more Vehicles in Household
It is essential to understand that the correlation between the percentage of Bermudans and percentage of households with 1 or more vehicles available does not imply a direct cause-and-effect relationship. It remains uncertain whether the presence of Bermudans influences an upward or downward trend in the level of percentage of households with 1 or more vehicles available within an area, or if Bermudans simply ended up residing in those areas with higher or lower levels of percentage of households with 1 or more vehicles available due to other factors.

Demographics Similar to Bermudans by 1 or more Vehicles in Household

In terms of 1 or more vehicles in household, the demographic groups most similar to Bermudans are Panamanian (87.5%, a difference of 0.010%), Immigrants from Africa (87.6%, a difference of 0.020%), Aleut (87.5%, a difference of 0.060%), Immigrants from Europe (87.6%, a difference of 0.070%), and Immigrants from Colombia (87.6%, a difference of 0.10%).
DemographicsRating | Rank1 or more Vehicles in Household
Immigrants from Liberia
0.4
/100
|
#264
Tragic
87.8%
Africans
0.4
/100
|
#265
Tragic
87.8%
Israelis
0.3
/100
|
#266
Tragic
87.7%
Immigrants from Colombia
0.3
/100
|
#267
Tragic
87.6%
Immigrants from Europe
0.2
/100
|
#268
Tragic
87.6%
Immigrants from Africa
0.2
/100
|
#269
Tragic
87.6%
Panamanians
0.2
/100
|
#270
Tragic
87.5%
Bermudans
0.2
/100
|
#271
Tragic
87.5%
Aleuts
0.2
/100
|
#272
Tragic
87.5%
Immigrants from Northern Africa
0.2
/100
|
#273
Tragic
87.4%
Immigrants from Morocco
0.1
/100
|
#274
Tragic
87.4%
Immigrants from Singapore
0.1
/100
|
#275
Tragic
87.2%
Immigrants from France
0.1
/100
|
#276
Tragic
87.1%
Alsatians
0.1
/100
|
#277
Tragic
87.1%
Immigrants from Southern Europe
0.1
/100
|
#278
Tragic
87.1%

Bermudan 1 or more Vehicles in Household Correlation Summary

MeasurementBermudan Data1 or more Vehicles in Household Data
Minimum0.0057%74.2%
Maximum13.0%100.0%
Range13.0%25.8%
Mean0.99%92.9%
Median0.53%94.4%
Interquartile 25% (IQ1)0.25%89.4%
Interquartile 75% (IQ3)1.1%97.7%
Interquartile Range (IQR)0.83%8.3%
Standard Deviation (Sample)1.8%6.2%
Standard Deviation (Population)1.8%6.2%

Correlation Details

Bermudan PercentileSample Size1 or more Vehicles in Household
[
0.0%
-
0.5%
]
0.0057%
42,083,12277.3%
[
0.0%
-
0.5%
]
0.027%
5,755,74585.5%
[
0.0%
-
0.5%
]
0.046%
2,608,68189.6%
[
0.0%
-
0.5%
]
0.067%
1,350,23091.3%
[
0.0%
-
0.5%
]
0.087%
877,73291.2%
[
0.0%
-
0.5%
]
0.11%
582,21183.7%
[
0.0%
-
0.5%
]
0.13%
180,20188.7%
[
0.0%
-
0.5%
]
0.15%
364,44683.2%
[
0.0%
-
0.5%
]
0.16%
196,46996.9%
[
0.0%
-
0.5%
]
0.18%
329,04191.7%
[
0.0%
-
0.5%
]
0.20%
212,77286.8%
[
0.0%
-
0.5%
]
0.23%
122,99379.5%
[
0.0%
-
0.5%
]
0.25%
59,22394.0%
[
0.0%
-
0.5%
]
0.26%
194,03383.1%
[
0.0%
-
0.5%
]
0.29%
82,84795.0%
[
0.0%
-
0.5%
]
0.30%
99,45986.7%
[
0.0%
-
0.5%
]
0.32%
29,91096.6%
[
0.0%
-
0.5%
]
0.34%
40,37389.4%
[
0.0%
-
0.5%
]
0.38%
17,67189.5%
[
0.0%
-
0.5%
]
0.40%
23,33596.1%
[
0.0%
-
0.5%
]
0.42%
72,98995.1%
[
0.0%
-
0.5%
]
0.44%
3,21298.6%
[
0.0%
-
0.5%
]
0.46%
45,26997.0%
[
0.0%
-
0.5%
]
0.48%
33,52374.2%
[
0.0%
-
0.5%
]
0.49%
2,03996.3%
[
0.5%
-
1.0%
]
0.51%
7,64888.3%
[
0.5%
-
1.0%
]
0.54%
48,36193.3%
[
0.5%
-
1.0%
]
0.55%
62,89192.0%
[
0.5%
-
1.0%
]
0.59%
3,40698.5%
[
0.5%
-
1.0%
]
0.68%
2,05098.5%
[
0.5%
-
1.0%
]
0.70%
5,11598.8%
[
0.5%
-
1.0%
]
0.73%
2,73199.5%
[
0.5%
-
1.0%
]
0.82%
10,60296.2%
[
0.5%
-
1.0%
]
0.85%
51,93889.8%
[
0.5%
-
1.0%
]
0.86%
3,00698.2%
[
0.5%
-
1.0%
]
0.92%
5,33889.3%
[
0.5%
-
1.0%
]
0.95%
4,22197.2%
[
1.0%
-
1.5%
]
1.01%
24,55192.9%
[
1.0%
-
1.5%
]
1.05%
1,81896.8%
[
1.0%
-
1.5%
]
1.12%
896100.0%
[
1.0%
-
1.5%
]
1.16%
9,76797.8%
[
1.0%
-
1.5%
]
1.18%
93293.8%
[
1.0%
-
1.5%
]
1.25%
8,00288.3%
[
1.0%
-
1.5%
]
1.27%
8,32697.5%
[
1.0%
-
1.5%
]
1.33%
2,414100.0%
[
1.0%
-
1.5%
]
1.50%
468100.0%
[
1.5%
-
2.0%
]
1.64%
2,690100.0%
[
1.5%
-
2.0%
]
1.73%
17396.5%
[
2.0%
-
2.5%
]
2.31%
3,77094.0%
[
2.5%
-
3.0%
]
2.94%
374100.0%
[
3.5%
-
4.0%
]
3.89%
5,480100.0%
[
12.5%
-
13.0%
]
12.96%
54894.8%