Australian Married-couple Households

COMPARE

Australian
Race
Ancestry
AfghanAfricanAlaska NativeAlaskan AthabascanAlbanianAleutAlsatianAmericanApacheArabArapahoArgentineanArmenianAssyrian/Chaldean/SyriacAustralianAustrianBahamianBangladeshiBarbadianBasqueBelgianBelizeanBermudanBhutaneseBlackfeetBolivianBrazilianBritishBritish West IndianBulgarianBurmeseCajunCambodianCanadianCape VerdeanCarpatho RusynCelticCentral AmericanCentral American IndianCherokeeCheyenneChickasawChileanChineseChippewaChoctawColombianColvilleComancheCosta RicanCreeCreekCroatianCrowCubanCypriotCzechCzechoslovakianDanishDelawareDominicanDutchDutch West IndianEastern EuropeanEcuadorianEgyptianEnglishEstonianEthiopianEuropeanFijianFilipinoFinnishFrenchFrench American IndianFrench CanadianGermanGerman RussianGhanaianGreekGuamanian/ChamorroGuatemalanGuyaneseHaitianHmongHonduranHopiHoumaHungarianIcelanderIndian (Asian)IndonesianInupiatIranianIraqiIrishIroquoisIsraeliItalianJamaicanJapaneseJordanianKenyanKiowaKoreanLaotianLatvianLebaneseLiberianLithuanianLumbeeLuxembourgerMacedonianMalaysianMalteseMarshalleseMenomineeMexicanMexican American IndianMongolianMoroccanNative HawaiianNavajoNepaleseNew ZealanderNicaraguanNigerianNorthern EuropeanNorwegianOkinawanOsageOttawaPaiutePakistaniPalestinianPanamanianParaguayanPennsylvania GermanPeruvianPimaPolishPortuguesePotawatomiPuebloPuerto RicanPuget Sound SalishRomanianRussianSalvadoranSamoanScandinavianScotch-IrishScottishSeminoleSenegaleseSerbianShoshoneSierra LeoneanSiouxSlavicSlovakSloveneSomaliSouth AfricanSouth AmericanSouth American IndianSoviet UnionSpaniardSpanishSpanish AmericanSpanish American IndianSri LankanSubsaharan AfricanSudaneseSwedishSwissSyrianTaiwaneseThaiTlingit-HaidaTohono O'OdhamTonganTrinidadian and TobagonianTsimshianTurkishU.S. Virgin IslanderUgandanUkrainianUruguayanUteVenezuelanVietnameseWelshWest IndianYakamaYaquiYugoslavianYumanYup'ikZimbabwean
Immigration
NonimmigrantsImmigrantsAfghanistanAfricaAlbaniaArgentinaArmeniaAsiaAustraliaAustriaBahamasBangladeshBarbadosBelarusBelgiumBelizeBoliviaBosnia and HerzegovinaBrazilBulgariaBurma/MyanmarCabo VerdeCambodiaCameroonCanadaCaribbeanCentral AmericaChileChinaColombiaCongoCosta RicaCroatiaCubaCzechoslovakiaDenmarkDominicaDominican RepublicEastern AfricaEastern AsiaEastern EuropeEcuadorEgyptEl SalvadorEnglandEritreaEthiopiaEuropeFijiFranceGermanyGhanaGreeceGrenadaGuatemalaGuyanaHaitiHondurasHong KongHungaryIndiaIndonesiaIranIraqIrelandIsraelItalyJamaicaJapanJordanKazakhstanKenyaKoreaKuwaitLaosLatin AmericaLatviaLebanonLiberiaLithuaniaMalaysiaMexicoMicronesiaMiddle AfricaMoldovaMoroccoNepalNetherlandsNicaraguaNigeriaNorth AmericaNorth MacedoniaNorthern AfricaNorthern EuropeNorwayOceaniaPakistanPanamaPeruPhilippinesPolandPortugalRomaniaRussiaSaudi ArabiaScotlandSenegalSerbiaSierra LeoneSingaporeSomaliaSouth AfricaSouth AmericaSouth Central AsiaSouth Eastern AsiaSouthern EuropeSpainSri LankaSt. Vincent and the GrenadinesSudanSwedenSwitzerlandSyriaTaiwanThailandTrinidad and TobagoTurkeyUgandaUkraineUruguayUzbekistanVenezuelaVietnamWest IndiesWestern AfricaWestern AsiaWestern EuropeYemenZaireZimbabweAzores
Select to Compare
Race
Ancestry
AfghanAfricanAlaska NativeAlaskan AthabascanAlbanianAleutAlsatianAmericanApacheArabArapahoArgentineanArmenianAssyrian/Chaldean/SyriacAustrianBahamianBangladeshiBarbadianBasqueBelgianBelizeanBermudanBhutaneseBlackfeetBolivianBrazilianBritishBritish West IndianBulgarianBurmeseCajunCambodianCanadianCape VerdeanCarpatho RusynCelticCentral AmericanCentral American IndianCherokeeCheyenneChickasawChileanChineseChippewaChoctawColombianColvilleComancheCosta RicanCreeCreekCroatianCrowCubanCypriotCzechCzechoslovakianDanishDelawareDominicanDutchDutch West IndianEastern EuropeanEcuadorianEgyptianEnglishEstonianEthiopianEuropeanFijianFilipinoFinnishFrenchFrench American IndianFrench CanadianGermanGerman RussianGhanaianGreekGuamanian/ChamorroGuatemalanGuyaneseHaitianHmongHonduranHopiHoumaHungarianIcelanderIndian (Asian)IndonesianInupiatIranianIraqiIrishIroquoisIsraeliItalianJamaicanJapaneseJordanianKenyanKiowaKoreanLaotianLatvianLebaneseLiberianLithuanianLumbeeLuxembourgerMacedonianMalaysianMalteseMarshalleseMenomineeMexicanMexican American IndianMongolianMoroccanNative HawaiianNavajoNepaleseNew ZealanderNicaraguanNigerianNorthern EuropeanNorwegianOkinawanOsageOttawaPaiutePakistaniPalestinianPanamanianParaguayanPennsylvania GermanPeruvianPimaPolishPortuguesePotawatomiPuebloPuerto RicanPuget Sound SalishRomanianRussianSalvadoranSamoanScandinavianScotch-IrishScottishSeminoleSenegaleseSerbianShoshoneSierra LeoneanSiouxSlavicSlovakSloveneSomaliSouth AfricanSouth AmericanSouth American IndianSoviet UnionSpaniardSpanishSpanish AmericanSpanish American IndianSri LankanSubsaharan AfricanSudaneseSwedishSwissSyrianTaiwaneseThaiTlingit-HaidaTohono O'OdhamTonganTrinidadian and TobagonianTsimshianTurkishU.S. Virgin IslanderUgandanUkrainianUruguayanUteVenezuelanVietnameseWelshWest IndianYakamaYaquiYugoslavianYumanYup'ikZimbabwean
Immigration
NonimmigrantsImmigrantsAfghanistanAfricaAlbaniaArgentinaArmeniaAsiaAustraliaAustriaBahamasBangladeshBarbadosBelarusBelgiumBelizeBoliviaBosnia and HerzegovinaBrazilBulgariaBurma/MyanmarCabo VerdeCambodiaCameroonCanadaCaribbeanCentral AmericaChileChinaColombiaCongoCosta RicaCroatiaCubaCzechoslovakiaDenmarkDominicaDominican RepublicEastern AfricaEastern AsiaEastern EuropeEcuadorEgyptEl SalvadorEnglandEritreaEthiopiaEuropeFijiFranceGermanyGhanaGreeceGrenadaGuatemalaGuyanaHaitiHondurasHong KongHungaryIndiaIndonesiaIranIraqIrelandIsraelItalyJamaicaJapanJordanKazakhstanKenyaKoreaKuwaitLaosLatin AmericaLatviaLebanonLiberiaLithuaniaMalaysiaMexicoMicronesiaMiddle AfricaMoldovaMoroccoNepalNetherlandsNicaraguaNigeriaNorth AmericaNorth MacedoniaNorthern AfricaNorthern EuropeNorwayOceaniaPakistanPanamaPeruPhilippinesPolandPortugalRomaniaRussiaSaudi ArabiaScotlandSenegalSerbiaSierra LeoneSingaporeSomaliaSouth AfricaSouth AmericaSouth Central AsiaSouth Eastern AsiaSouthern EuropeSpainSri LankaSt. Vincent and the GrenadinesSudanSwedenSwitzerlandSyriaTaiwanThailandTrinidad and TobagoTurkeyUgandaUkraineUruguayUzbekistanVenezuelaVietnamWest IndiesWestern AfricaWestern AsiaWestern EuropeYemenZaireZimbabweAzores
Married-couple Households
Income
Poverty
Unemployment
Labor Participation
Family Structure
Vehicle Availability
Education Level
Disability

Australian Married-couple Households
Excellent

47.4%
MARRIED-COUPLE HOUSEHOLDS
89.0/ 100
METRIC RATING
125th/ 347
METRIC RANK

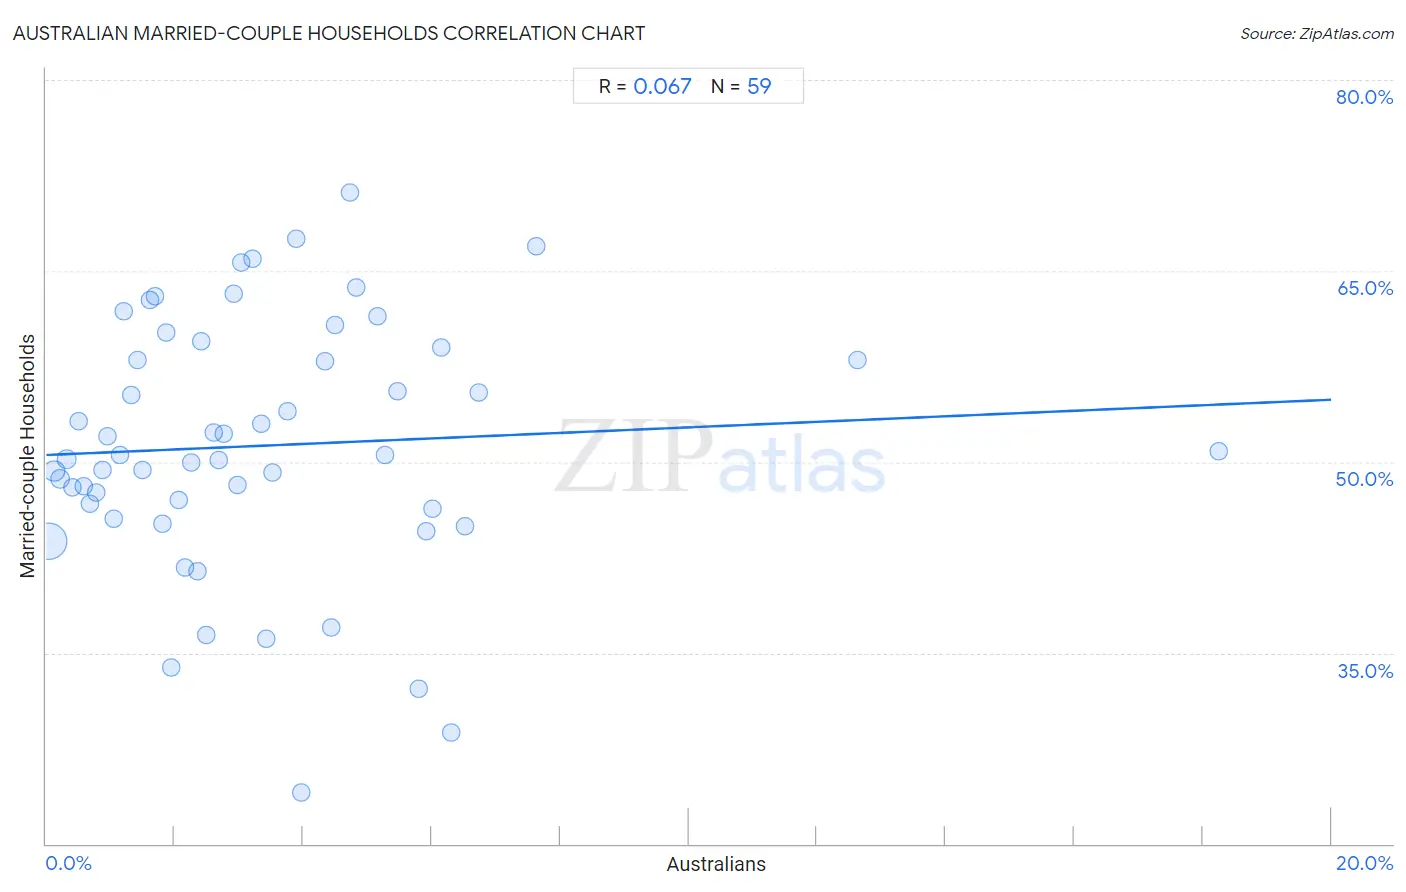
Australian Married-couple Households Correlation Chart

The statistical analysis conducted on geographies consisting of 224,029,086 people shows a slight positive correlation between the proportion of Australians and percentage of married-couple family households in the United States with a correlation coefficient (R) of 0.067 and weighted average of 47.4%. On average, for every 1% (one percent) increase in Australians within a typical geography, there is an increase of 0.22% in percentage of married-couple family households.
Australian Married-couple Households
It is essential to understand that the correlation between the percentage of Australians and percentage of married-couple family households does not imply a direct cause-and-effect relationship. It remains uncertain whether the presence of Australians influences an upward or downward trend in the level of percentage of married-couple family households within an area, or if Australians simply ended up residing in those areas with higher or lower levels of percentage of married-couple family households due to other factors.

Demographics Similar to Australians by Married-couple Households

In terms of married-couple households, the demographic groups most similar to Australians are Zimbabwean (47.4%, a difference of 0.020%), Immigrants from Venezuela (47.4%, a difference of 0.030%), Pakistani (47.3%, a difference of 0.030%), Celtic (47.3%, a difference of 0.080%), and Immigrants from Peru (47.3%, a difference of 0.10%).
DemographicsRating | RankMarried-couple Households
Immigrants from Germany
92.4
/100
|
#118
Exceptional
47.5%
Chileans
92.2
/100
|
#119
Exceptional
47.5%
Puget Sound Salish
90.5
/100
|
#120
Exceptional
47.4%
Immigrants from Eastern Europe
90.3
/100
|
#121
Exceptional
47.4%
Okinawans
90.1
/100
|
#122
Exceptional
47.4%
Immigrants from Venezuela
89.3
/100
|
#123
Excellent
47.4%
Zimbabweans
89.2
/100
|
#124
Excellent
47.4%
Australians
89.0
/100
|
#125
Excellent
47.4%
Pakistanis
88.6
/100
|
#126
Excellent
47.3%
Celtics
88.1
/100
|
#127
Excellent
47.3%
Immigrants from Peru
87.9
/100
|
#128
Excellent
47.3%
Immigrants from Iraq
87.8
/100
|
#129
Excellent
47.3%
Immigrants from Hungary
87.8
/100
|
#130
Excellent
47.3%
Immigrants from Denmark
87.5
/100
|
#131
Excellent
47.3%
Immigrants from Ukraine
86.7
/100
|
#132
Excellent
47.3%

Australian Married-couple Households Correlation Summary

MeasurementAustralian DataMarried-couple Households Data
Minimum0.037%24.0%
Maximum18.3%71.2%
Range18.2%47.2%
Mean3.4%51.3%
Median2.7%50.6%
Interquartile 25% (IQ1)1.3%46.3%
Interquartile 75% (IQ3)4.7%59.0%
Interquartile Range (IQR)3.4%12.7%
Standard Deviation (Sample)3.1%9.9%
Standard Deviation (Population)3.0%9.9%

Correlation Details

Australian PercentileSample SizeMarried-couple Households
[
0.0%
-
0.5%
]
0.037%
176,698,15443.8%
[
0.0%
-
0.5%
]
0.13%
27,477,15549.3%
[
0.0%
-
0.5%
]
0.22%
9,435,35748.6%
[
0.0%
-
0.5%
]
0.32%
4,035,29450.2%
[
0.0%
-
0.5%
]
0.40%
2,242,28148.0%
[
0.5%
-
1.0%
]
0.50%
1,308,69753.2%
[
0.5%
-
1.0%
]
0.58%
825,28148.1%
[
0.5%
-
1.0%
]
0.68%
593,62246.7%
[
0.5%
-
1.0%
]
0.77%
429,13347.6%
[
0.5%
-
1.0%
]
0.87%
288,73949.4%
[
0.5%
-
1.0%
]
0.96%
125,38852.0%
[
1.0%
-
1.5%
]
1.06%
38,77645.5%
[
1.0%
-
1.5%
]
1.14%
51,61150.6%
[
1.0%
-
1.5%
]
1.20%
40,71961.8%
[
1.0%
-
1.5%
]
1.32%
81,20255.2%
[
1.0%
-
1.5%
]
1.42%
28,89858.0%
[
1.5%
-
2.0%
]
1.51%
37,39249.4%
[
1.5%
-
2.0%
]
1.61%
62,59862.8%
[
1.5%
-
2.0%
]
1.70%
25,33963.0%
[
1.5%
-
2.0%
]
1.80%
41,52845.2%
[
1.5%
-
2.0%
]
1.86%
21,16360.2%
[
1.5%
-
2.0%
]
1.95%
37,31433.9%
[
2.0%
-
2.5%
]
2.06%
7,72547.0%
[
2.0%
-
2.5%
]
2.17%
3,45841.7%
[
2.0%
-
2.5%
]
2.26%
5,18149.9%
[
2.0%
-
2.5%
]
2.35%
15,72941.4%
[
2.0%
-
2.5%
]
2.40%
2,28859.5%
[
2.0%
-
2.5%
]
2.49%
10,85436.4%
[
2.5%
-
3.0%
]
2.61%
5,29752.3%
[
2.5%
-
3.0%
]
2.69%
2,56650.1%
[
2.5%
-
3.0%
]
2.76%
2,17252.2%
[
2.5%
-
3.0%
]
2.91%
37863.2%
[
2.5%
-
3.0%
]
2.98%
3,25548.2%
[
3.0%
-
3.5%
]
3.04%
2,82765.6%
[
3.0%
-
3.5%
]
3.22%
4,44265.9%
[
3.0%
-
3.5%
]
3.34%
10,22853.0%
[
3.0%
-
3.5%
]
3.42%
10,04736.1%
[
3.5%
-
4.0%
]
3.51%
31349.1%
[
3.5%
-
4.0%
]
3.75%
77453.9%
[
3.5%
-
4.0%
]
3.89%
18067.5%
[
3.5%
-
4.0%
]
3.98%
35224.0%
[
4.0%
-
4.5%
]
4.35%
82857.9%
[
4.0%
-
4.5%
]
4.43%
15837.0%
[
4.5%
-
5.0%
]
4.50%
1,06660.8%
[
4.5%
-
5.0%
]
4.73%
82571.2%
[
4.5%
-
5.0%
]
4.83%
3,19063.7%
[
5.0%
-
5.5%
]
5.15%
2,01861.4%
[
5.0%
-
5.5%
]
5.27%
66450.6%
[
5.0%
-
5.5%
]
5.48%
42055.6%
[
5.5%
-
6.0%
]
5.81%
15532.1%
[
5.5%
-
6.0%
]
5.92%
71044.5%
[
6.0%
-
6.5%
]
6.02%
1,39646.3%
[
6.0%
-
6.5%
]
6.15%
13059.0%
[
6.0%
-
6.5%
]
6.31%
30128.7%
[
6.5%
-
7.0%
]
6.51%
82944.9%
[
6.5%
-
7.0%
]
6.73%
1,30755.4%
[
7.5%
-
8.0%
]
7.62%
84067.0%
[
12.5%
-
13.0%
]
12.62%
30158.0%
[
18.0%
-
18.5%
]
18.26%
24150.8%