Australian College, 1 year or more
COMPARE
Australian
Select to Compare
College, 1 year or more
Australian College, 1 year or more
64.6%
COLLEGE, 1 YEAR OR MORE
99.9/ 100
METRIC RATING
47th/ 347
METRIC RANK
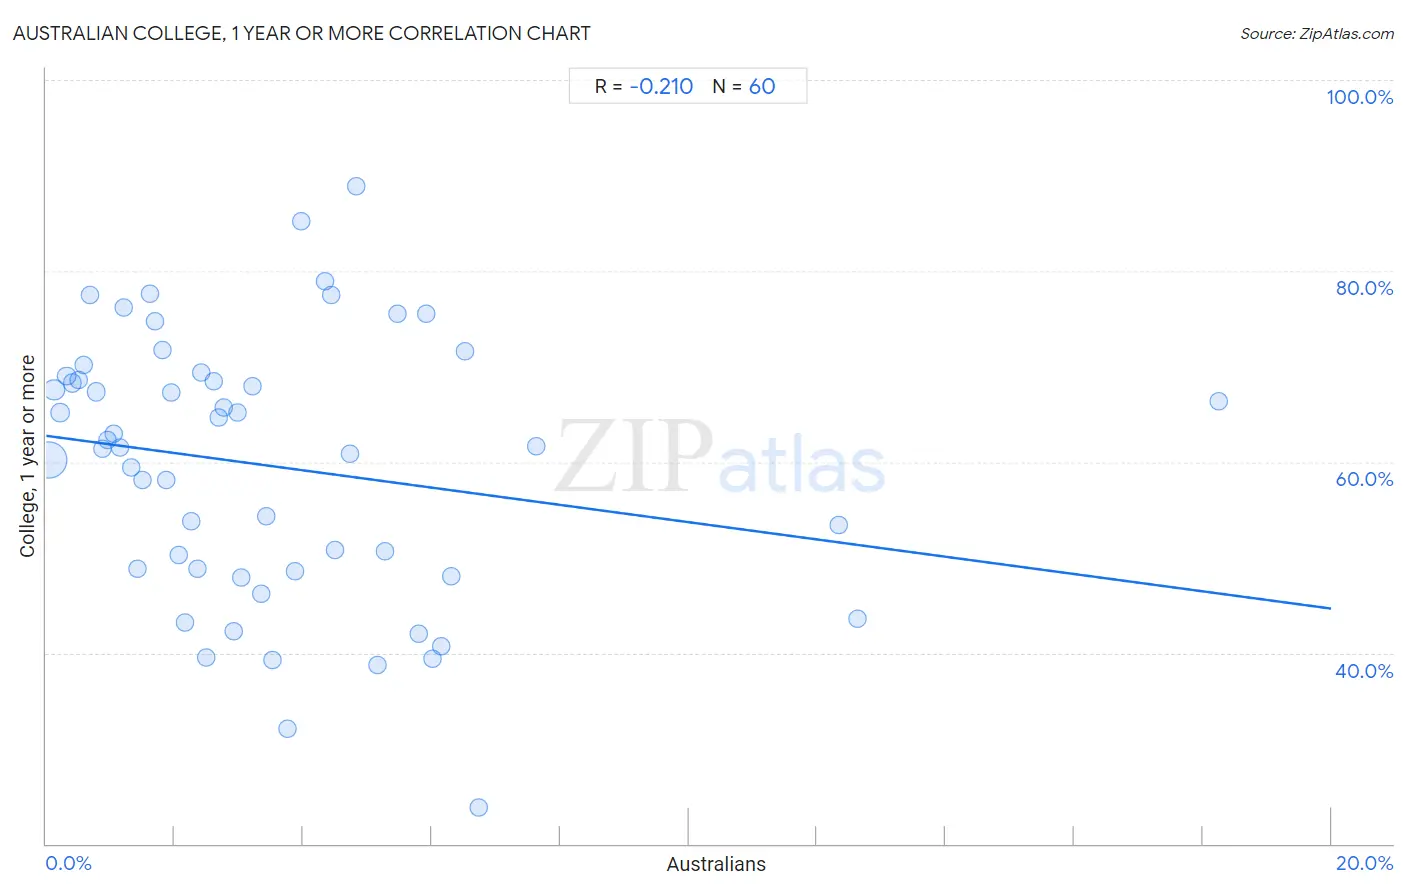
Australian College, 1 year or more Correlation Chart
The statistical analysis conducted on geographies consisting of 224,162,526 people shows a weak negative correlation between the proportion of Australians and percentage of population with at least college, 1 year or more education in the United States with a correlation coefficient (R) of -0.210 and weighted average of 64.6%. On average, for every 1% (one percent) increase in Australians within a typical geography, there is a decrease of 0.91% in percentage of population with at least college, 1 year or more education.
It is essential to understand that the correlation between the percentage of Australians and percentage of population with at least college, 1 year or more education does not imply a direct cause-and-effect relationship. It remains uncertain whether the presence of Australians influences an upward or downward trend in the level of percentage of population with at least college, 1 year or more education within an area, or if Australians simply ended up residing in those areas with higher or lower levels of percentage of population with at least college, 1 year or more education due to other factors.
Demographics Similar to Australians by College, 1 year or more
In terms of college, 1 year or more, the demographic groups most similar to Australians are Bhutanese (64.6%, a difference of 0.010%), Immigrants from Lithuania (64.6%, a difference of 0.020%), Immigrants from Bulgaria (64.6%, a difference of 0.030%), New Zealander (64.6%, a difference of 0.070%), and Immigrants from Norway (64.7%, a difference of 0.18%).
| Demographics | Rating | Rank | College, 1 year or more |
| Immigrants from Kuwait | 99.9 /100 | #40 | Exceptional 65.0% |
| Mongolians | 99.9 /100 | #41 | Exceptional 64.8% |
| Immigrants from Latvia | 99.9 /100 | #42 | Exceptional 64.8% |
| Immigrants from Russia | 99.9 /100 | #43 | Exceptional 64.7% |
| Immigrants from Norway | 99.9 /100 | #44 | Exceptional 64.7% |
| Immigrants from Lithuania | 99.9 /100 | #45 | Exceptional 64.6% |
| Bhutanese | 99.9 /100 | #46 | Exceptional 64.6% |
| Australians | 99.9 /100 | #47 | Exceptional 64.6% |
| Immigrants from Bulgaria | 99.9 /100 | #48 | Exceptional 64.6% |
| New Zealanders | 99.9 /100 | #49 | Exceptional 64.6% |
| Immigrants from Austria | 99.8 /100 | #50 | Exceptional 64.4% |
| Immigrants from Malaysia | 99.8 /100 | #51 | Exceptional 64.3% |
| Immigrants from Netherlands | 99.8 /100 | #52 | Exceptional 64.2% |
| Asians | 99.8 /100 | #53 | Exceptional 64.2% |
| Zimbabweans | 99.8 /100 | #54 | Exceptional 64.2% |
Australian College, 1 year or more Correlation Summary
| Measurement | Australian Data | College, 1 year or more Data |
| Minimum | 0.037% | 23.7% |
| Maximum | 18.3% | 88.8% |
| Range | 18.2% | 65.1% |
| Mean | 3.5% | 59.6% |
| Median | 2.7% | 61.6% |
| Interquartile 25% (IQ1) | 1.4% | 48.6% |
| Interquartile 75% (IQ3) | 4.8% | 68.8% |
| Interquartile Range (IQR) | 3.4% | 20.2% |
| Standard Deviation (Sample) | 3.2% | 14.0% |
| Standard Deviation (Population) | 3.2% | 13.8% |
Correlation Details
| Australian Percentile | Sample Size | College, 1 year or more |
[ 0.0% - 0.5% ] 0.037% | 176,717,180 | 60.3% |
[ 0.0% - 0.5% ] 0.13% | 27,529,367 | 67.6% |
[ 0.0% - 0.5% ] 0.22% | 9,451,444 | 65.2% |
[ 0.0% - 0.5% ] 0.32% | 4,039,207 | 69.0% |
[ 0.0% - 0.5% ] 0.40% | 2,254,609 | 68.3% |
[ 0.5% - 1.0% ] 0.50% | 1,308,697 | 68.6% |
[ 0.5% - 1.0% ] 0.58% | 843,168 | 70.1% |
[ 0.5% - 1.0% ] 0.68% | 593,622 | 77.5% |
[ 0.5% - 1.0% ] 0.77% | 431,088 | 67.3% |
[ 0.5% - 1.0% ] 0.87% | 290,639 | 61.3% |
[ 0.5% - 1.0% ] 0.96% | 128,669 | 62.3% |
[ 1.0% - 1.5% ] 1.06% | 38,776 | 62.9% |
[ 1.0% - 1.5% ] 1.14% | 51,611 | 61.5% |
[ 1.0% - 1.5% ] 1.20% | 40,719 | 76.1% |
[ 1.0% - 1.5% ] 1.32% | 82,601 | 59.4% |
[ 1.0% - 1.5% ] 1.42% | 28,898 | 48.8% |
[ 1.5% - 2.0% ] 1.51% | 37,392 | 58.1% |
[ 1.5% - 2.0% ] 1.61% | 62,598 | 77.6% |
[ 1.5% - 2.0% ] 1.70% | 25,339 | 74.7% |
[ 1.5% - 2.0% ] 1.80% | 41,528 | 71.7% |
[ 1.5% - 2.0% ] 1.86% | 21,163 | 58.1% |
[ 1.5% - 2.0% ] 1.95% | 40,272 | 67.2% |
[ 2.0% - 2.5% ] 2.06% | 7,725 | 50.3% |
[ 2.0% - 2.5% ] 2.17% | 3,458 | 43.2% |
[ 2.0% - 2.5% ] 2.26% | 5,181 | 53.8% |
[ 2.0% - 2.5% ] 2.35% | 15,729 | 48.8% |
[ 2.0% - 2.5% ] 2.40% | 2,288 | 69.4% |
[ 2.0% - 2.5% ] 2.49% | 10,854 | 39.5% |
[ 2.5% - 3.0% ] 2.61% | 5,297 | 68.4% |
[ 2.5% - 3.0% ] 2.69% | 2,566 | 64.6% |
[ 2.5% - 3.0% ] 2.76% | 2,172 | 65.6% |
[ 2.5% - 3.0% ] 2.91% | 378 | 42.2% |
[ 2.5% - 3.0% ] 2.98% | 3,255 | 65.2% |
[ 3.0% - 3.5% ] 3.04% | 2,827 | 47.9% |
[ 3.0% - 3.5% ] 3.22% | 4,442 | 67.9% |
[ 3.0% - 3.5% ] 3.34% | 10,228 | 46.2% |
[ 3.0% - 3.5% ] 3.42% | 10,047 | 54.3% |
[ 3.5% - 4.0% ] 3.51% | 313 | 39.3% |
[ 3.5% - 4.0% ] 3.75% | 774 | 32.0% |
[ 3.5% - 4.0% ] 3.88% | 438 | 48.5% |
[ 3.5% - 4.0% ] 3.98% | 352 | 85.1% |
[ 4.0% - 4.5% ] 4.34% | 991 | 78.9% |
[ 4.0% - 4.5% ] 4.43% | 158 | 77.5% |
[ 4.5% - 5.0% ] 4.50% | 1,066 | 50.8% |
[ 4.5% - 5.0% ] 4.73% | 825 | 60.8% |
[ 4.5% - 5.0% ] 4.83% | 3,190 | 88.8% |
[ 5.0% - 5.5% ] 5.15% | 2,018 | 38.7% |
[ 5.0% - 5.5% ] 5.27% | 664 | 50.6% |
[ 5.0% - 5.5% ] 5.48% | 420 | 75.5% |
[ 5.5% - 6.0% ] 5.81% | 155 | 41.9% |
[ 5.5% - 6.0% ] 5.92% | 710 | 75.5% |
[ 6.0% - 6.5% ] 6.02% | 1,396 | 39.3% |
[ 6.0% - 6.5% ] 6.15% | 130 | 40.6% |
[ 6.0% - 6.5% ] 6.31% | 301 | 48.0% |
[ 6.5% - 7.0% ] 6.51% | 829 | 71.6% |
[ 6.5% - 7.0% ] 6.73% | 1,307 | 23.7% |
[ 7.5% - 8.0% ] 7.62% | 840 | 61.6% |
[ 12.0% - 12.5% ] 12.33% | 73 | 53.4% |
[ 12.5% - 13.0% ] 12.62% | 301 | 43.6% |
[ 18.0% - 18.5% ] 18.26% | 241 | 66.4% |