Australian Self-Care Disability

COMPARE

Australian
Race
Ancestry
AfghanAfricanAlaska NativeAlaskan AthabascanAlbanianAleutAlsatianAmericanApacheArabArapahoArgentineanArmenianAssyrian/Chaldean/SyriacAustralianAustrianBahamianBangladeshiBarbadianBasqueBelgianBelizeanBermudanBhutaneseBlackfeetBolivianBrazilianBritishBritish West IndianBulgarianBurmeseCajunCambodianCanadianCape VerdeanCarpatho RusynCelticCentral AmericanCentral American IndianCherokeeCheyenneChickasawChileanChineseChippewaChoctawColombianColvilleComancheCosta RicanCreeCreekCroatianCrowCubanCypriotCzechCzechoslovakianDanishDelawareDominicanDutchDutch West IndianEastern EuropeanEcuadorianEgyptianEnglishEstonianEthiopianEuropeanFijianFilipinoFinnishFrenchFrench American IndianFrench CanadianGermanGerman RussianGhanaianGreekGuamanian/ChamorroGuatemalanGuyaneseHaitianHmongHonduranHopiHoumaHungarianIcelanderIndian (Asian)IndonesianInupiatIranianIraqiIrishIroquoisIsraeliItalianJamaicanJapaneseJordanianKenyanKiowaKoreanLaotianLatvianLebaneseLiberianLithuanianLumbeeLuxembourgerMacedonianMalaysianMalteseMarshalleseMenomineeMexicanMexican American IndianMongolianMoroccanNative HawaiianNavajoNepaleseNew ZealanderNicaraguanNigerianNorthern EuropeanNorwegianOkinawanOsageOttawaPaiutePakistaniPalestinianPanamanianParaguayanPennsylvania GermanPeruvianPimaPolishPortuguesePotawatomiPuebloPuerto RicanPuget Sound SalishRomanianRussianSalvadoranSamoanScandinavianScotch-IrishScottishSeminoleSenegaleseSerbianShoshoneSierra LeoneanSiouxSlavicSlovakSloveneSomaliSouth AfricanSouth AmericanSouth American IndianSoviet UnionSpaniardSpanishSpanish AmericanSpanish American IndianSri LankanSubsaharan AfricanSudaneseSwedishSwissSyrianTaiwaneseThaiTlingit-HaidaTohono O'OdhamTonganTrinidadian and TobagonianTsimshianTurkishU.S. Virgin IslanderUgandanUkrainianUruguayanUteVenezuelanVietnameseWelshWest IndianYakamaYaquiYugoslavianYumanYup'ikZimbabwean
Immigration
NonimmigrantsImmigrantsAfghanistanAfricaAlbaniaArgentinaArmeniaAsiaAustraliaAustriaBahamasBangladeshBarbadosBelarusBelgiumBelizeBoliviaBosnia and HerzegovinaBrazilBulgariaBurma/MyanmarCabo VerdeCambodiaCameroonCanadaCaribbeanCentral AmericaChileChinaColombiaCongoCosta RicaCroatiaCubaCzechoslovakiaDenmarkDominicaDominican RepublicEastern AfricaEastern AsiaEastern EuropeEcuadorEgyptEl SalvadorEnglandEritreaEthiopiaEuropeFijiFranceGermanyGhanaGreeceGrenadaGuatemalaGuyanaHaitiHondurasHong KongHungaryIndiaIndonesiaIranIraqIrelandIsraelItalyJamaicaJapanJordanKazakhstanKenyaKoreaKuwaitLaosLatin AmericaLatviaLebanonLiberiaLithuaniaMalaysiaMexicoMicronesiaMiddle AfricaMoldovaMoroccoNepalNetherlandsNicaraguaNigeriaNorth AmericaNorth MacedoniaNorthern AfricaNorthern EuropeNorwayOceaniaPakistanPanamaPeruPhilippinesPolandPortugalRomaniaRussiaSaudi ArabiaScotlandSenegalSerbiaSierra LeoneSingaporeSomaliaSouth AfricaSouth AmericaSouth Central AsiaSouth Eastern AsiaSouthern EuropeSpainSri LankaSt. Vincent and the GrenadinesSudanSwedenSwitzerlandSyriaTaiwanThailandTrinidad and TobagoTurkeyUgandaUkraineUruguayUzbekistanVenezuelaVietnamWest IndiesWestern AfricaWestern AsiaWestern EuropeYemenZaireZimbabweAzores
Select to Compare
Race
Ancestry
AfghanAfricanAlaska NativeAlaskan AthabascanAlbanianAleutAlsatianAmericanApacheArabArapahoArgentineanArmenianAssyrian/Chaldean/SyriacAustrianBahamianBangladeshiBarbadianBasqueBelgianBelizeanBermudanBhutaneseBlackfeetBolivianBrazilianBritishBritish West IndianBulgarianBurmeseCajunCambodianCanadianCape VerdeanCarpatho RusynCelticCentral AmericanCentral American IndianCherokeeCheyenneChickasawChileanChineseChippewaChoctawColombianColvilleComancheCosta RicanCreeCreekCroatianCrowCubanCypriotCzechCzechoslovakianDanishDelawareDominicanDutchDutch West IndianEastern EuropeanEcuadorianEgyptianEnglishEstonianEthiopianEuropeanFijianFilipinoFinnishFrenchFrench American IndianFrench CanadianGermanGerman RussianGhanaianGreekGuamanian/ChamorroGuatemalanGuyaneseHaitianHmongHonduranHopiHoumaHungarianIcelanderIndian (Asian)IndonesianInupiatIranianIraqiIrishIroquoisIsraeliItalianJamaicanJapaneseJordanianKenyanKiowaKoreanLaotianLatvianLebaneseLiberianLithuanianLumbeeLuxembourgerMacedonianMalaysianMalteseMarshalleseMenomineeMexicanMexican American IndianMongolianMoroccanNative HawaiianNavajoNepaleseNew ZealanderNicaraguanNigerianNorthern EuropeanNorwegianOkinawanOsageOttawaPaiutePakistaniPalestinianPanamanianParaguayanPennsylvania GermanPeruvianPimaPolishPortuguesePotawatomiPuebloPuerto RicanPuget Sound SalishRomanianRussianSalvadoranSamoanScandinavianScotch-IrishScottishSeminoleSenegaleseSerbianShoshoneSierra LeoneanSiouxSlavicSlovakSloveneSomaliSouth AfricanSouth AmericanSouth American IndianSoviet UnionSpaniardSpanishSpanish AmericanSpanish American IndianSri LankanSubsaharan AfricanSudaneseSwedishSwissSyrianTaiwaneseThaiTlingit-HaidaTohono O'OdhamTonganTrinidadian and TobagonianTsimshianTurkishU.S. Virgin IslanderUgandanUkrainianUruguayanUteVenezuelanVietnameseWelshWest IndianYakamaYaquiYugoslavianYumanYup'ikZimbabwean
Immigration
NonimmigrantsImmigrantsAfghanistanAfricaAlbaniaArgentinaArmeniaAsiaAustraliaAustriaBahamasBangladeshBarbadosBelarusBelgiumBelizeBoliviaBosnia and HerzegovinaBrazilBulgariaBurma/MyanmarCabo VerdeCambodiaCameroonCanadaCaribbeanCentral AmericaChileChinaColombiaCongoCosta RicaCroatiaCubaCzechoslovakiaDenmarkDominicaDominican RepublicEastern AfricaEastern AsiaEastern EuropeEcuadorEgyptEl SalvadorEnglandEritreaEthiopiaEuropeFijiFranceGermanyGhanaGreeceGrenadaGuatemalaGuyanaHaitiHondurasHong KongHungaryIndiaIndonesiaIranIraqIrelandIsraelItalyJamaicaJapanJordanKazakhstanKenyaKoreaKuwaitLaosLatin AmericaLatviaLebanonLiberiaLithuaniaMalaysiaMexicoMicronesiaMiddle AfricaMoldovaMoroccoNepalNetherlandsNicaraguaNigeriaNorth AmericaNorth MacedoniaNorthern AfricaNorthern EuropeNorwayOceaniaPakistanPanamaPeruPhilippinesPolandPortugalRomaniaRussiaSaudi ArabiaScotlandSenegalSerbiaSierra LeoneSingaporeSomaliaSouth AfricaSouth AmericaSouth Central AsiaSouth Eastern AsiaSouthern EuropeSpainSri LankaSt. Vincent and the GrenadinesSudanSwedenSwitzerlandSyriaTaiwanThailandTrinidad and TobagoTurkeyUgandaUkraineUruguayUzbekistanVenezuelaVietnamWest IndiesWestern AfricaWestern AsiaWestern EuropeYemenZaireZimbabweAzores
Self-Care Disability
Income
Poverty
Unemployment
Labor Participation
Family Structure
Vehicle Availability
Education Level
Disability

Australian Self-Care Disability
Exceptional

2.3%
SELF-CARE DISABILITY
99.6/ 100
METRIC RATING
53rd/ 347
METRIC RANK

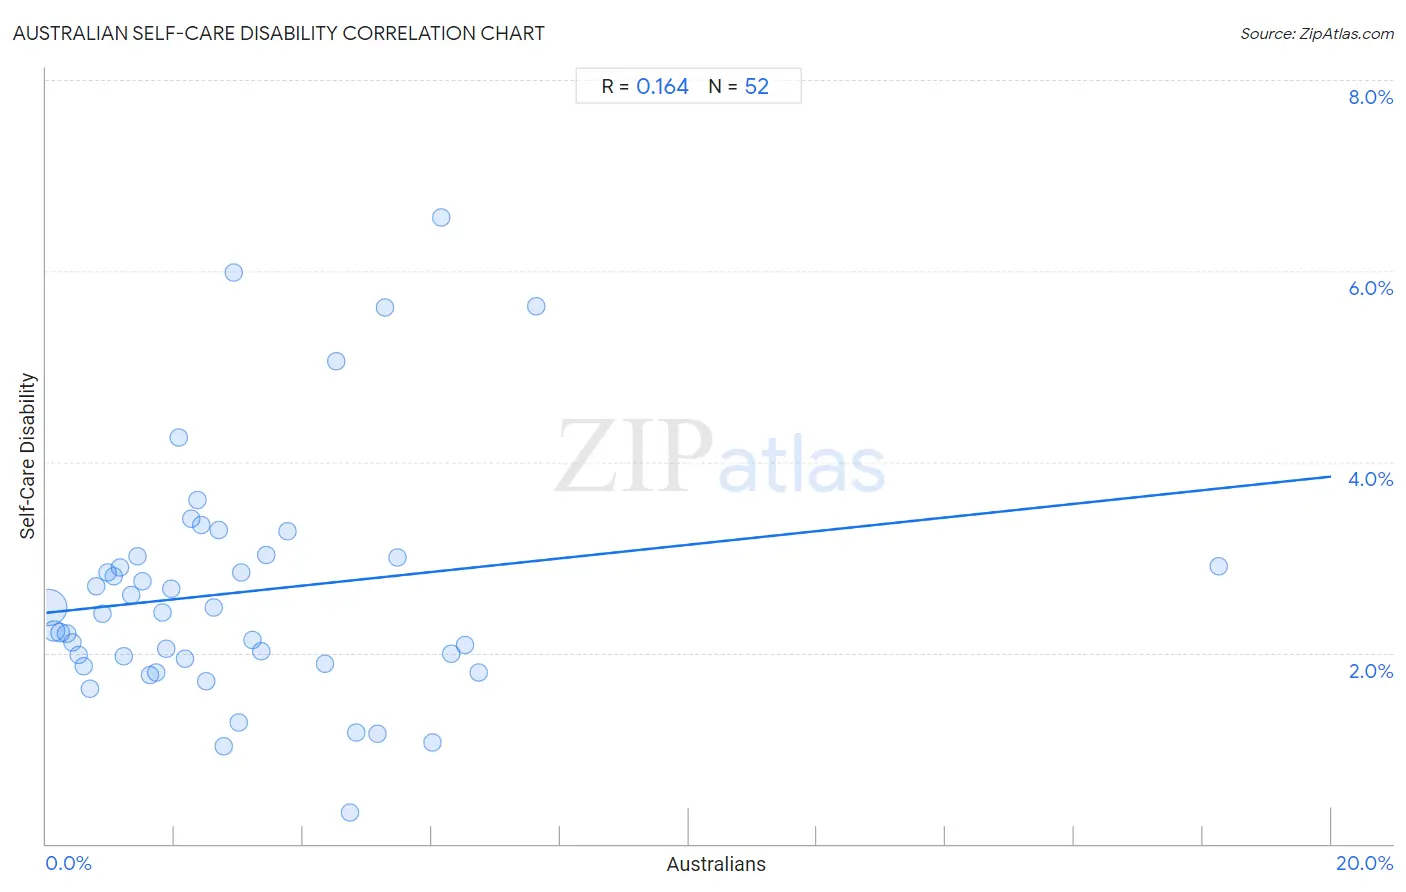
Australian Self-Care Disability Correlation Chart

The statistical analysis conducted on geographies consisting of 223,956,744 people shows a poor positive correlation between the proportion of Australians and percentage of population with self-care disability in the United States with a correlation coefficient (R) of 0.164 and weighted average of 2.3%. On average, for every 1% (one percent) increase in Australians within a typical geography, there is an increase of 0.071% in percentage of population with self-care disability.
Australian Self-Care Disability
It is essential to understand that the correlation between the percentage of Australians and percentage of population with self-care disability does not imply a direct cause-and-effect relationship. It remains uncertain whether the presence of Australians influences an upward or downward trend in the level of percentage of population with self-care disability within an area, or if Australians simply ended up residing in those areas with higher or lower levels of percentage of population with self-care disability due to other factors.

Demographics Similar to Australians by Self-Care Disability

In terms of self-care disability, the demographic groups most similar to Australians are Immigrants from Serbia (2.3%, a difference of 0.030%), Argentinean (2.3%, a difference of 0.050%), Kenyan (2.3%, a difference of 0.060%), Immigrants from France (2.3%, a difference of 0.11%), and Immigrants from Eastern Asia (2.3%, a difference of 0.15%).
DemographicsRating | RankSelf-Care Disability
Czechs
99.8
/100
|
#46
Exceptional
2.3%
Jordanians
99.7
/100
|
#47
Exceptional
2.3%
Immigrants from Malaysia
99.7
/100
|
#48
Exceptional
2.3%
Latvians
99.7
/100
|
#49
Exceptional
2.3%
Immigrants from Brazil
99.7
/100
|
#50
Exceptional
2.3%
Kenyans
99.7
/100
|
#51
Exceptional
2.3%
Immigrants from Serbia
99.6
/100
|
#52
Exceptional
2.3%
Australians
99.6
/100
|
#53
Exceptional
2.3%
Argentineans
99.6
/100
|
#54
Exceptional
2.3%
Immigrants from France
99.6
/100
|
#55
Exceptional
2.3%
Immigrants from Eastern Asia
99.6
/100
|
#56
Exceptional
2.3%
Immigrants from Belgium
99.6
/100
|
#57
Exceptional
2.3%
Immigrants from Cameroon
99.6
/100
|
#58
Exceptional
2.3%
New Zealanders
99.5
/100
|
#59
Exceptional
2.3%
Immigrants from Japan
99.5
/100
|
#60
Exceptional
2.3%

Australian Self-Care Disability Correlation Summary

MeasurementAustralian DataSelf-Care Disability Data
Minimum0.037%0.32%
Maximum18.3%6.6%
Range18.2%6.2%
Mean3.0%2.6%
Median2.4%2.4%
Interquartile 25% (IQ1)1.2%1.9%
Interquartile 75% (IQ3)4.4%3.0%
Interquartile Range (IQR)3.3%1.1%
Standard Deviation (Sample)2.9%1.3%
Standard Deviation (Population)2.9%1.3%

Correlation Details

Australian PercentileSample SizeSelf-Care Disability
[
0.0%
-
0.5%
]
0.037%
176,683,4212.5%
[
0.0%
-
0.5%
]
0.13%
27,474,0882.2%
[
0.0%
-
0.5%
]
0.22%
9,427,8492.2%
[
0.0%
-
0.5%
]
0.32%
4,029,7442.2%
[
0.0%
-
0.5%
]
0.40%
2,238,1892.1%
[
0.5%
-
1.0%
]
0.50%
1,308,6972.0%
[
0.5%
-
1.0%
]
0.58%
828,6731.9%
[
0.5%
-
1.0%
]
0.68%
593,4741.6%
[
0.5%
-
1.0%
]
0.77%
425,2242.7%
[
0.5%
-
1.0%
]
0.87%
288,1862.4%
[
0.5%
-
1.0%
]
0.96%
124,6662.8%
[
1.0%
-
1.5%
]
1.06%
30,6682.8%
[
1.0%
-
1.5%
]
1.14%
49,5812.9%
[
1.0%
-
1.5%
]
1.20%
40,7192.0%
[
1.0%
-
1.5%
]
1.32%
81,2022.6%
[
1.0%
-
1.5%
]
1.42%
27,9933.0%
[
1.5%
-
2.0%
]
1.51%
36,8592.7%
[
1.5%
-
2.0%
]
1.62%
55,0681.8%
[
1.5%
-
2.0%
]
1.71%
22,1081.8%
[
1.5%
-
2.0%
]
1.80%
41,5282.4%
[
1.5%
-
2.0%
]
1.87%
17,0792.0%
[
1.5%
-
2.0%
]
1.95%
37,3142.7%
[
2.0%
-
2.5%
]
2.06%
7,1974.3%
[
2.0%
-
2.5%
]
2.17%
3,4581.9%
[
2.0%
-
2.5%
]
2.26%
5,1813.4%
[
2.0%
-
2.5%
]
2.35%
15,7293.6%
[
2.0%
-
2.5%
]
2.40%
2,2883.3%
[
2.0%
-
2.5%
]
2.49%
10,8141.7%
[
2.5%
-
3.0%
]
2.61%
5,2972.5%
[
2.5%
-
3.0%
]
2.69%
2,5663.3%
[
2.5%
-
3.0%
]
2.76%
1,8121.0%
[
2.5%
-
3.0%
]
2.91%
3786.0%
[
3.0%
-
3.5%
]
3.00%
1,0331.3%
[
3.0%
-
3.5%
]
3.04%
2,5342.8%
[
3.0%
-
3.5%
]
3.21%
3,2372.1%
[
3.0%
-
3.5%
]
3.34%
9,8102.0%
[
3.0%
-
3.5%
]
3.42%
10,0473.0%
[
3.5%
-
4.0%
]
3.75%
7743.3%
[
4.0%
-
4.5%
]
4.35%
8281.9%
[
4.5%
-
5.0%
]
4.52%
1995.1%
[
4.5%
-
5.0%
]
4.72%
6350.32%
[
4.5%
-
5.0%
]
4.83%
3,1901.2%
[
5.0%
-
5.5%
]
5.15%
1,4941.2%
[
5.0%
-
5.5%
]
5.27%
6645.6%
[
5.0%
-
5.5%
]
5.48%
4203.0%
[
6.0%
-
6.5%
]
6.02%
1,3961.1%
[
6.0%
-
6.5%
]
6.15%
1306.6%
[
6.0%
-
6.5%
]
6.31%
3012.0%
[
6.5%
-
7.0%
]
6.51%
6142.1%
[
6.5%
-
7.0%
]
6.73%
1,3071.8%
[
7.5%
-
8.0%
]
7.62%
8405.6%
[
18.0%
-
18.5%
]
18.26%
2412.9%