Australian 4 or more Vehicles in Household
COMPARE
Australian
Select to Compare
4 or more Vehicles in Household
Australian 4 or more Vehicles in Household
6.6%
4+ VEHICLES AVAILABLE
80.8/ 100
METRIC RATING
141st/ 347
METRIC RANK
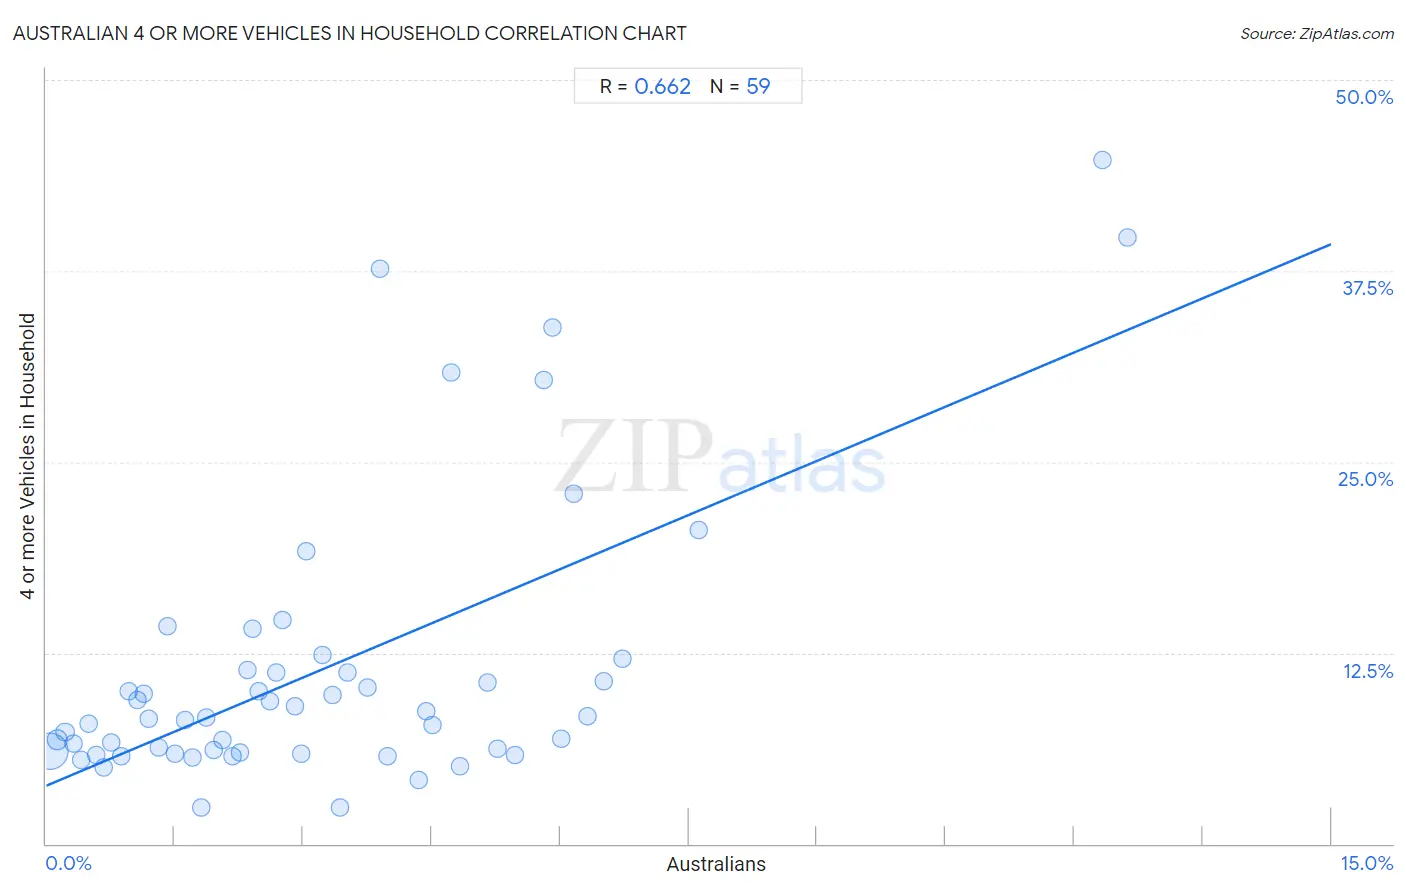
Australian 4 or more Vehicles in Household Correlation Chart
The statistical analysis conducted on geographies consisting of 223,029,698 people shows a significant positive correlation between the proportion of Australians and percentage of households with 4 or more vehicles available in the United States with a correlation coefficient (R) of 0.662 and weighted average of 6.6%. On average, for every 1% (one percent) increase in Australians within a typical geography, there is an increase of 2.4% in percentage of households with 4 or more vehicles available.
It is essential to understand that the correlation between the percentage of Australians and percentage of households with 4 or more vehicles available does not imply a direct cause-and-effect relationship. It remains uncertain whether the presence of Australians influences an upward or downward trend in the level of percentage of households with 4 or more vehicles available within an area, or if Australians simply ended up residing in those areas with higher or lower levels of percentage of households with 4 or more vehicles available due to other factors.
Demographics Similar to Australians by 4 or more Vehicles in Household
In terms of 4 or more vehicles in household, the demographic groups most similar to Australians are Slavic (6.6%, a difference of 0.13%), Immigrants from Iraq (6.5%, a difference of 0.20%), Jordanian (6.6%, a difference of 0.21%), Immigrants from Canada (6.5%, a difference of 0.33%), and Immigrants from North America (6.5%, a difference of 0.35%).
| Demographics | Rating | Rank | 4 or more Vehicles in Household |
| Ottawa | 86.9 /100 | #134 | Excellent 6.6% |
| Tohono O'odham | 86.7 /100 | #135 | Excellent 6.6% |
| Luxembourgers | 86.4 /100 | #136 | Excellent 6.6% |
| French Canadians | 85.4 /100 | #137 | Excellent 6.6% |
| Italians | 84.5 /100 | #138 | Excellent 6.6% |
| Jordanians | 82.1 /100 | #139 | Excellent 6.6% |
| Slavs | 81.6 /100 | #140 | Excellent 6.6% |
| Australians | 80.8 /100 | #141 | Excellent 6.6% |
| Immigrants from Iraq | 79.4 /100 | #142 | Good 6.5% |
| Immigrants from Canada | 78.6 /100 | #143 | Good 6.5% |
| Immigrants from North America | 78.5 /100 | #144 | Good 6.5% |
| Croatians | 77.8 /100 | #145 | Good 6.5% |
| Immigrants from Costa Rica | 74.4 /100 | #146 | Good 6.5% |
| Immigrants from Iran | 73.9 /100 | #147 | Good 6.5% |
| Immigrants from Jordan | 73.7 /100 | #148 | Good 6.5% |
Australian 4 or more Vehicles in Household Correlation Summary
| Measurement | Australian Data | 4 or more Vehicles in Household Data |
| Minimum | 0.037% | 2.4% |
| Maximum | 12.6% | 44.7% |
| Range | 12.6% | 42.4% |
| Mean | 3.3% | 11.5% |
| Median | 2.7% | 8.3% |
| Interquartile 25% (IQ1) | 1.3% | 6.0% |
| Interquartile 75% (IQ3) | 4.7% | 11.4% |
| Interquartile Range (IQR) | 3.4% | 5.4% |
| Standard Deviation (Sample) | 2.6% | 9.4% |
| Standard Deviation (Population) | 2.6% | 9.3% |
Correlation Details
| Australian Percentile | Sample Size | 4 or more Vehicles in Household |
[ 0.0% - 0.5% ] 0.037% | 176,412,655 | 6.1% |
[ 0.0% - 0.5% ] 0.13% | 27,127,336 | 6.8% |
[ 0.0% - 0.5% ] 0.22% | 9,312,283 | 7.3% |
[ 0.0% - 0.5% ] 0.32% | 3,933,470 | 6.6% |
[ 0.0% - 0.5% ] 0.40% | 2,227,583 | 5.5% |
[ 0.5% - 1.0% ] 0.50% | 1,307,247 | 7.8% |
[ 0.5% - 1.0% ] 0.58% | 822,424 | 5.8% |
[ 0.5% - 1.0% ] 0.68% | 564,697 | 5.0% |
[ 0.5% - 1.0% ] 0.76% | 363,826 | 6.7% |
[ 0.5% - 1.0% ] 0.87% | 288,186 | 5.7% |
[ 0.5% - 1.0% ] 0.96% | 118,101 | 9.9% |
[ 1.0% - 1.5% ] 1.06% | 34,197 | 9.4% |
[ 1.0% - 1.5% ] 1.14% | 49,581 | 9.8% |
[ 1.0% - 1.5% ] 1.20% | 40,719 | 8.2% |
[ 1.0% - 1.5% ] 1.32% | 81,202 | 6.3% |
[ 1.0% - 1.5% ] 1.42% | 28,898 | 14.3% |
[ 1.5% - 2.0% ] 1.51% | 37,392 | 5.9% |
[ 1.5% - 2.0% ] 1.62% | 55,318 | 8.1% |
[ 1.5% - 2.0% ] 1.70% | 22,651 | 5.6% |
[ 1.5% - 2.0% ] 1.80% | 41,528 | 2.4% |
[ 1.5% - 2.0% ] 1.86% | 21,163 | 8.3% |
[ 1.5% - 2.0% ] 1.95% | 37,314 | 6.1% |
[ 2.0% - 2.5% ] 2.06% | 7,725 | 6.8% |
[ 2.0% - 2.5% ] 2.17% | 3,458 | 5.7% |
[ 2.0% - 2.5% ] 2.26% | 5,181 | 6.0% |
[ 2.0% - 2.5% ] 2.35% | 15,729 | 11.4% |
[ 2.0% - 2.5% ] 2.40% | 2,288 | 14.1% |
[ 2.0% - 2.5% ] 2.49% | 10,814 | 10.0% |
[ 2.5% - 3.0% ] 2.61% | 5,297 | 9.4% |
[ 2.5% - 3.0% ] 2.69% | 2,566 | 11.3% |
[ 2.5% - 3.0% ] 2.76% | 1,812 | 14.6% |
[ 2.5% - 3.0% ] 2.91% | 378 | 9.0% |
[ 2.5% - 3.0% ] 2.98% | 2,850 | 5.9% |
[ 3.0% - 3.5% ] 3.04% | 2,827 | 19.1% |
[ 3.0% - 3.5% ] 3.22% | 4,442 | 12.4% |
[ 3.0% - 3.5% ] 3.34% | 10,107 | 9.8% |
[ 3.0% - 3.5% ] 3.42% | 10,047 | 2.4% |
[ 3.5% - 4.0% ] 3.51% | 313 | 11.2% |
[ 3.5% - 4.0% ] 3.75% | 774 | 10.2% |
[ 3.5% - 4.0% ] 3.89% | 180 | 37.7% |
[ 3.5% - 4.0% ] 3.98% | 352 | 5.7% |
[ 4.0% - 4.5% ] 4.35% | 828 | 4.2% |
[ 4.0% - 4.5% ] 4.43% | 158 | 8.7% |
[ 4.5% - 5.0% ] 4.50% | 1,066 | 7.8% |
[ 4.5% - 5.0% ] 4.73% | 825 | 30.9% |
[ 4.5% - 5.0% ] 4.83% | 3,190 | 5.1% |
[ 5.0% - 5.5% ] 5.15% | 1,708 | 10.6% |
[ 5.0% - 5.5% ] 5.27% | 550 | 6.2% |
[ 5.0% - 5.5% ] 5.48% | 420 | 5.8% |
[ 5.5% - 6.0% ] 5.81% | 155 | 30.4% |
[ 5.5% - 6.0% ] 5.92% | 710 | 33.8% |
[ 6.0% - 6.5% ] 6.02% | 1,396 | 6.9% |
[ 6.0% - 6.5% ] 6.15% | 130 | 23.0% |
[ 6.0% - 6.5% ] 6.31% | 301 | 8.3% |
[ 6.5% - 7.0% ] 6.51% | 829 | 10.6% |
[ 6.5% - 7.0% ] 6.73% | 1,307 | 12.1% |
[ 7.5% - 8.0% ] 7.62% | 840 | 20.6% |
[ 12.0% - 12.5% ] 12.33% | 73 | 44.7% |
[ 12.5% - 13.0% ] 12.62% | 301 | 39.7% |