Australian 3 or more Vehicles in Household
COMPARE
Australian
Select to Compare
3 or more Vehicles in Household
Australian 3 or more Vehicles in Household
20.1%
3+ VEHICLES AVAILABLE
83.6/ 100
METRIC RATING
146th/ 347
METRIC RANK
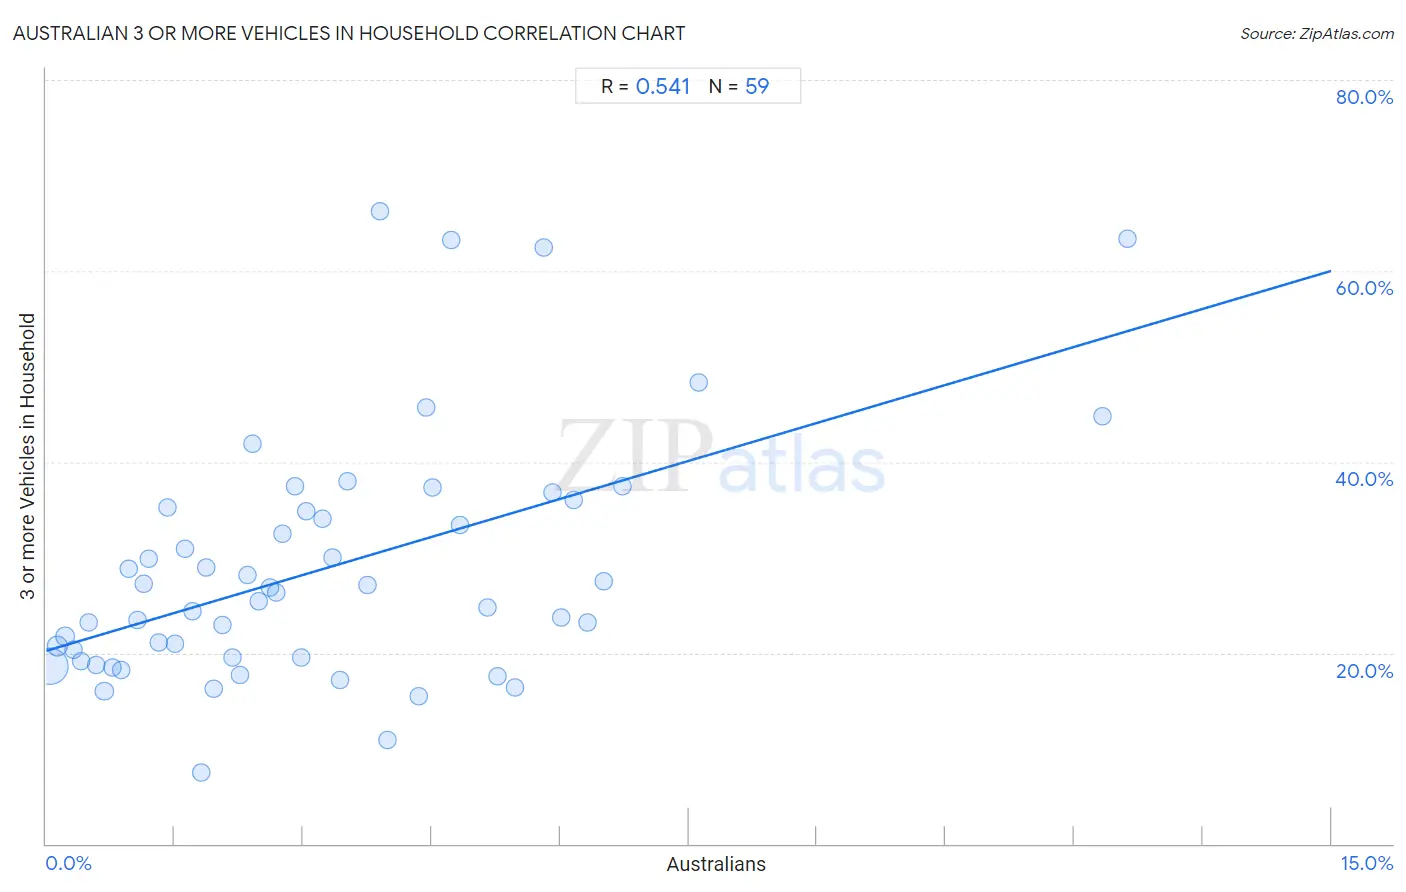
Australian 3 or more Vehicles in Household Correlation Chart
The statistical analysis conducted on geographies consisting of 223,939,161 people shows a substantial positive correlation between the proportion of Australians and percentage of households with 3 or more vehicles available in the United States with a correlation coefficient (R) of 0.541 and weighted average of 20.1%. On average, for every 1% (one percent) increase in Australians within a typical geography, there is an increase of 2.7% in percentage of households with 3 or more vehicles available.
It is essential to understand that the correlation between the percentage of Australians and percentage of households with 3 or more vehicles available does not imply a direct cause-and-effect relationship. It remains uncertain whether the presence of Australians influences an upward or downward trend in the level of percentage of households with 3 or more vehicles available within an area, or if Australians simply ended up residing in those areas with higher or lower levels of percentage of households with 3 or more vehicles available due to other factors.
Demographics Similar to Australians by 3 or more Vehicles in Household
In terms of 3 or more vehicles in household, the demographic groups most similar to Australians are Palestinian (20.1%, a difference of 0.040%), Iranian (20.1%, a difference of 0.050%), Slovak (20.1%, a difference of 0.080%), Jordanian (20.1%, a difference of 0.11%), and Lithuanian (20.1%, a difference of 0.11%).
| Demographics | Rating | Rank | 3 or more Vehicles in Household |
| Slovenes | 85.5 /100 | #139 | Excellent 20.2% |
| French American Indians | 85.3 /100 | #140 | Excellent 20.1% |
| Ottawa | 84.9 /100 | #141 | Excellent 20.1% |
| Jordanians | 84.4 /100 | #142 | Excellent 20.1% |
| Lithuanians | 84.4 /100 | #143 | Excellent 20.1% |
| Iranians | 84.0 /100 | #144 | Excellent 20.1% |
| Palestinians | 83.9 /100 | #145 | Excellent 20.1% |
| Australians | 83.6 /100 | #146 | Excellent 20.1% |
| Slovaks | 83.0 /100 | #147 | Excellent 20.1% |
| Guatemalans | 82.6 /100 | #148 | Excellent 20.1% |
| Immigrants from Iran | 80.9 /100 | #149 | Excellent 20.0% |
| Immigrants | 80.8 /100 | #150 | Excellent 20.0% |
| Taiwanese | 80.6 /100 | #151 | Excellent 20.0% |
| Lebanese | 79.8 /100 | #152 | Good 20.0% |
| Yuman | 75.6 /100 | #153 | Good 19.9% |
Australian 3 or more Vehicles in Household Correlation Summary
| Measurement | Australian Data | 3 or more Vehicles in Household Data |
| Minimum | 0.037% | 7.4% |
| Maximum | 12.6% | 66.2% |
| Range | 12.6% | 58.8% |
| Mean | 3.3% | 28.9% |
| Median | 2.7% | 26.3% |
| Interquartile 25% (IQ1) | 1.3% | 19.5% |
| Interquartile 75% (IQ3) | 4.7% | 35.2% |
| Interquartile Range (IQR) | 3.4% | 15.7% |
| Standard Deviation (Sample) | 2.6% | 12.9% |
| Standard Deviation (Population) | 2.6% | 12.8% |
Correlation Details
| Australian Percentile | Sample Size | 3 or more Vehicles in Household |
[ 0.0% - 0.5% ] 0.037% | 176,673,860 | 18.7% |
[ 0.0% - 0.5% ] 0.13% | 27,457,815 | 20.7% |
[ 0.0% - 0.5% ] 0.22% | 9,423,456 | 21.7% |
[ 0.0% - 0.5% ] 0.32% | 4,027,059 | 20.3% |
[ 0.0% - 0.5% ] 0.40% | 2,239,860 | 19.1% |
[ 0.5% - 1.0% ] 0.50% | 1,308,697 | 23.2% |
[ 0.5% - 1.0% ] 0.58% | 825,281 | 18.8% |
[ 0.5% - 1.0% ] 0.68% | 586,626 | 16.0% |
[ 0.5% - 1.0% ] 0.77% | 426,600 | 18.4% |
[ 0.5% - 1.0% ] 0.87% | 288,739 | 18.2% |
[ 0.5% - 1.0% ] 0.96% | 121,838 | 28.8% |
[ 1.0% - 1.5% ] 1.06% | 38,776 | 23.4% |
[ 1.0% - 1.5% ] 1.14% | 51,611 | 27.3% |
[ 1.0% - 1.5% ] 1.20% | 40,719 | 29.9% |
[ 1.0% - 1.5% ] 1.32% | 81,202 | 21.1% |
[ 1.0% - 1.5% ] 1.42% | 28,898 | 35.2% |
[ 1.5% - 2.0% ] 1.51% | 37,392 | 21.0% |
[ 1.5% - 2.0% ] 1.62% | 55,318 | 30.9% |
[ 1.5% - 2.0% ] 1.70% | 22,651 | 24.4% |
[ 1.5% - 2.0% ] 1.80% | 41,528 | 7.4% |
[ 1.5% - 2.0% ] 1.86% | 21,163 | 28.9% |
[ 1.5% - 2.0% ] 1.95% | 37,314 | 16.3% |
[ 2.0% - 2.5% ] 2.06% | 7,725 | 22.9% |
[ 2.0% - 2.5% ] 2.17% | 3,458 | 19.6% |
[ 2.0% - 2.5% ] 2.26% | 5,181 | 17.6% |
[ 2.0% - 2.5% ] 2.35% | 15,729 | 28.2% |
[ 2.0% - 2.5% ] 2.40% | 2,288 | 41.9% |
[ 2.0% - 2.5% ] 2.49% | 10,854 | 25.5% |
[ 2.5% - 3.0% ] 2.61% | 5,297 | 26.8% |
[ 2.5% - 3.0% ] 2.69% | 2,566 | 26.3% |
[ 2.5% - 3.0% ] 2.76% | 2,172 | 32.5% |
[ 2.5% - 3.0% ] 2.91% | 378 | 37.4% |
[ 2.5% - 3.0% ] 2.98% | 2,850 | 19.5% |
[ 3.0% - 3.5% ] 3.04% | 2,827 | 34.8% |
[ 3.0% - 3.5% ] 3.22% | 4,442 | 34.0% |
[ 3.0% - 3.5% ] 3.34% | 10,228 | 30.0% |
[ 3.0% - 3.5% ] 3.42% | 10,047 | 17.2% |
[ 3.5% - 4.0% ] 3.51% | 313 | 37.9% |
[ 3.5% - 4.0% ] 3.75% | 774 | 27.2% |
[ 3.5% - 4.0% ] 3.89% | 180 | 66.2% |
[ 3.5% - 4.0% ] 3.98% | 352 | 10.9% |
[ 4.0% - 4.5% ] 4.35% | 828 | 15.4% |
[ 4.0% - 4.5% ] 4.43% | 158 | 45.7% |
[ 4.5% - 5.0% ] 4.50% | 1,066 | 37.3% |
[ 4.5% - 5.0% ] 4.73% | 825 | 63.2% |
[ 4.5% - 5.0% ] 4.83% | 3,190 | 33.4% |
[ 5.0% - 5.5% ] 5.15% | 2,018 | 24.8% |
[ 5.0% - 5.5% ] 5.27% | 550 | 17.5% |
[ 5.0% - 5.5% ] 5.48% | 420 | 16.4% |
[ 5.5% - 6.0% ] 5.81% | 155 | 62.5% |
[ 5.5% - 6.0% ] 5.92% | 710 | 36.8% |
[ 6.0% - 6.5% ] 6.02% | 1,396 | 23.7% |
[ 6.0% - 6.5% ] 6.15% | 130 | 36.1% |
[ 6.0% - 6.5% ] 6.31% | 301 | 23.1% |
[ 6.5% - 7.0% ] 6.51% | 829 | 27.4% |
[ 6.5% - 7.0% ] 6.73% | 1,307 | 37.5% |
[ 7.5% - 8.0% ] 7.62% | 840 | 48.3% |
[ 12.0% - 12.5% ] 12.33% | 73 | 44.7% |
[ 12.5% - 13.0% ] 12.62% | 301 | 63.4% |