Australian 1 or more Vehicles in Household
COMPARE
Australian
Select to Compare
1 or more Vehicles in Household
Australian 1 or more Vehicles in Household
90.0%
1+ VEHICLES AVAILABLE
72.4/ 100
METRIC RATING
156th/ 347
METRIC RANK
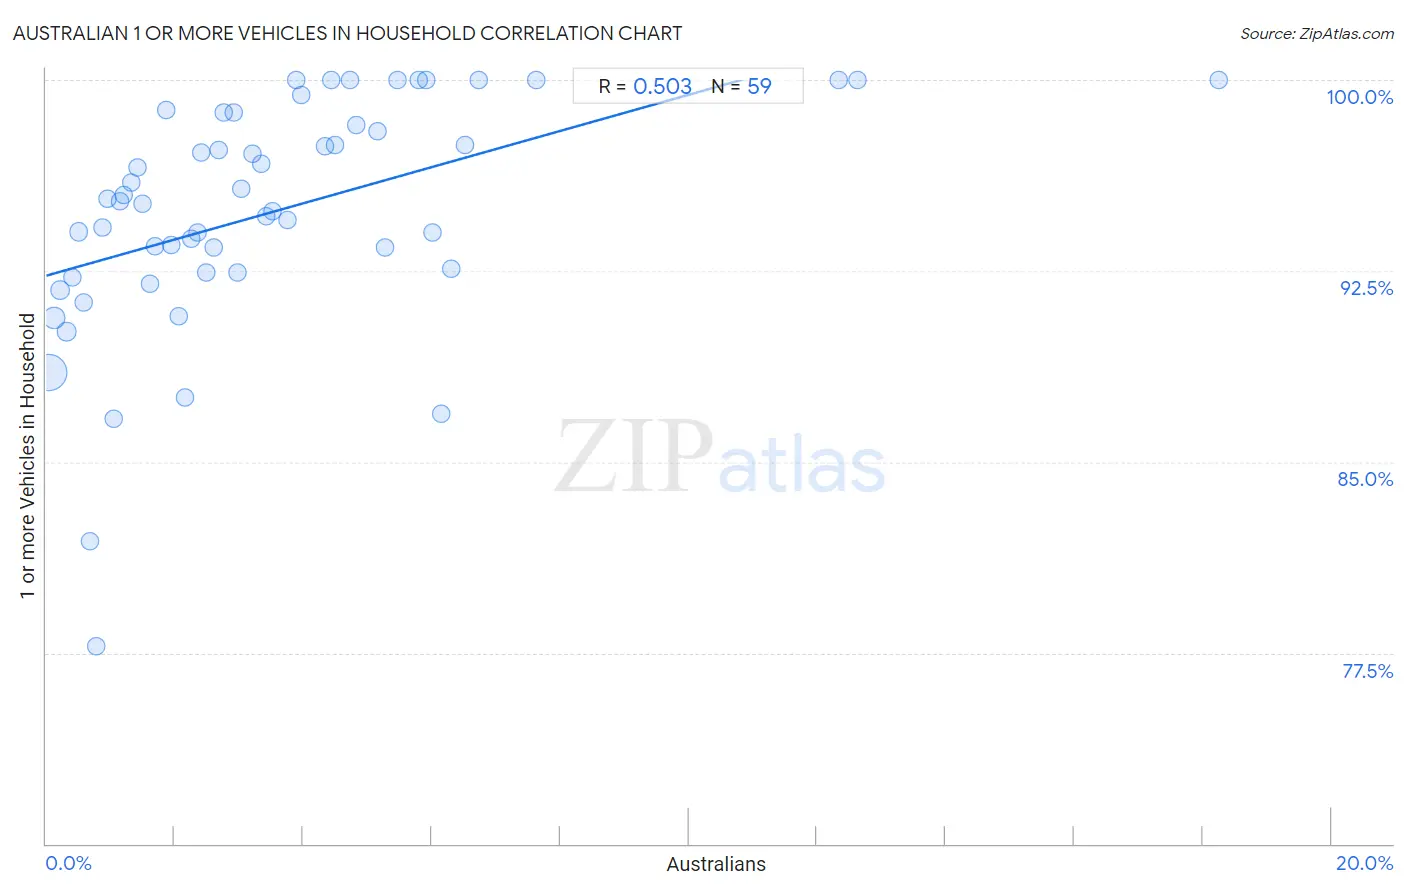
Australian 1 or more Vehicles in Household Correlation Chart
The statistical analysis conducted on geographies consisting of 224,001,878 people shows a substantial positive correlation between the proportion of Australians and percentage of households with 1 or more vehicles available in the United States with a correlation coefficient (R) of 0.503 and weighted average of 90.0%. On average, for every 1% (one percent) increase in Australians within a typical geography, there is an increase of 0.71% in percentage of households with 1 or more vehicles available.
It is essential to understand that the correlation between the percentage of Australians and percentage of households with 1 or more vehicles available does not imply a direct cause-and-effect relationship. It remains uncertain whether the presence of Australians influences an upward or downward trend in the level of percentage of households with 1 or more vehicles available within an area, or if Australians simply ended up residing in those areas with higher or lower levels of percentage of households with 1 or more vehicles available due to other factors.
Demographics Similar to Australians by 1 or more Vehicles in Household
In terms of 1 or more vehicles in household, the demographic groups most similar to Australians are Immigrants (90.1%, a difference of 0.020%), Immigrants from Congo (90.0%, a difference of 0.020%), New Zealander (90.1%, a difference of 0.030%), Immigrants from Uganda (90.1%, a difference of 0.030%), and Brazilian (90.0%, a difference of 0.030%).
| Demographics | Rating | Rank | 1 or more Vehicles in Household |
| Immigrants from Nicaragua | 76.7 /100 | #149 | Good 90.1% |
| Immigrants from Micronesia | 75.9 /100 | #150 | Good 90.1% |
| Immigrants from Bosnia and Herzegovina | 75.4 /100 | #151 | Good 90.1% |
| Tlingit-Haida | 74.3 /100 | #152 | Good 90.1% |
| New Zealanders | 73.8 /100 | #153 | Good 90.1% |
| Immigrants from Uganda | 73.8 /100 | #154 | Good 90.1% |
| Immigrants | 73.6 /100 | #155 | Good 90.1% |
| Australians | 72.4 /100 | #156 | Good 90.0% |
| Immigrants from Congo | 71.2 /100 | #157 | Good 90.0% |
| Brazilians | 71.0 /100 | #158 | Good 90.0% |
| South Africans | 69.7 /100 | #159 | Good 90.0% |
| Immigrants from Indonesia | 68.8 /100 | #160 | Good 90.0% |
| Salvadorans | 68.7 /100 | #161 | Good 90.0% |
| Spanish American Indians | 67.0 /100 | #162 | Good 89.9% |
| Immigrants from Austria | 65.5 /100 | #163 | Good 89.9% |
Australian 1 or more Vehicles in Household Correlation Summary
| Measurement | Australian Data | 1 or more Vehicles in Household Data |
| Minimum | 0.037% | 77.7% |
| Maximum | 18.3% | 100.0% |
| Range | 18.2% | 22.3% |
| Mean | 3.5% | 94.8% |
| Median | 2.8% | 95.3% |
| Interquartile 25% (IQ1) | 1.3% | 92.4% |
| Interquartile 75% (IQ3) | 4.8% | 98.7% |
| Interquartile Range (IQR) | 3.5% | 6.3% |
| Standard Deviation (Sample) | 3.3% | 4.6% |
| Standard Deviation (Population) | 3.2% | 4.6% |
Correlation Details
| Australian Percentile | Sample Size | 1 or more Vehicles in Household |
[ 0.0% - 0.5% ] 0.037% | 176,698,154 | 88.5% |
[ 0.0% - 0.5% ] 0.13% | 27,483,056 | 90.7% |
[ 0.0% - 0.5% ] 0.22% | 9,443,023 | 91.7% |
[ 0.0% - 0.5% ] 0.32% | 4,035,974 | 90.1% |
[ 0.0% - 0.5% ] 0.40% | 2,242,281 | 92.3% |
[ 0.5% - 1.0% ] 0.50% | 1,308,697 | 94.0% |
[ 0.5% - 1.0% ] 0.58% | 825,281 | 91.3% |
[ 0.5% - 1.0% ] 0.68% | 593,622 | 81.9% |
[ 0.5% - 1.0% ] 0.77% | 429,133 | 77.7% |
[ 0.5% - 1.0% ] 0.87% | 288,739 | 94.2% |
[ 0.5% - 1.0% ] 0.96% | 125,388 | 95.3% |
[ 1.0% - 1.5% ] 1.06% | 38,776 | 86.7% |
[ 1.0% - 1.5% ] 1.14% | 51,611 | 95.3% |
[ 1.0% - 1.5% ] 1.20% | 40,719 | 95.5% |
[ 1.0% - 1.5% ] 1.32% | 81,202 | 96.0% |
[ 1.0% - 1.5% ] 1.42% | 28,898 | 96.6% |
[ 1.5% - 2.0% ] 1.51% | 37,392 | 95.1% |
[ 1.5% - 2.0% ] 1.61% | 62,598 | 92.0% |
[ 1.5% - 2.0% ] 1.70% | 25,339 | 93.5% |
[ 1.5% - 2.0% ] 1.86% | 21,163 | 98.8% |
[ 1.5% - 2.0% ] 1.95% | 37,314 | 93.5% |
[ 2.0% - 2.5% ] 2.06% | 7,725 | 90.7% |
[ 2.0% - 2.5% ] 2.17% | 3,458 | 87.5% |
[ 2.0% - 2.5% ] 2.26% | 5,181 | 93.7% |
[ 2.0% - 2.5% ] 2.35% | 15,729 | 94.0% |
[ 2.0% - 2.5% ] 2.40% | 2,288 | 97.1% |
[ 2.0% - 2.5% ] 2.49% | 10,854 | 92.4% |
[ 2.5% - 3.0% ] 2.61% | 5,297 | 93.4% |
[ 2.5% - 3.0% ] 2.69% | 2,566 | 97.3% |
[ 2.5% - 3.0% ] 2.76% | 2,172 | 98.7% |
[ 2.5% - 3.0% ] 2.91% | 378 | 98.7% |
[ 2.5% - 3.0% ] 2.98% | 3,255 | 92.4% |
[ 3.0% - 3.5% ] 3.04% | 2,827 | 95.8% |
[ 3.0% - 3.5% ] 3.22% | 4,442 | 97.1% |
[ 3.0% - 3.5% ] 3.34% | 10,228 | 96.7% |
[ 3.0% - 3.5% ] 3.42% | 10,047 | 94.6% |
[ 3.5% - 4.0% ] 3.51% | 313 | 94.8% |
[ 3.5% - 4.0% ] 3.75% | 774 | 94.5% |
[ 3.5% - 4.0% ] 3.89% | 180 | 100.0% |
[ 3.5% - 4.0% ] 3.98% | 352 | 99.4% |
[ 4.0% - 4.5% ] 4.35% | 828 | 97.4% |
[ 4.0% - 4.5% ] 4.43% | 158 | 100.0% |
[ 4.5% - 5.0% ] 4.50% | 1,066 | 97.5% |
[ 4.5% - 5.0% ] 4.73% | 825 | 100.0% |
[ 4.5% - 5.0% ] 4.83% | 3,190 | 98.2% |
[ 5.0% - 5.5% ] 5.15% | 2,018 | 98.0% |
[ 5.0% - 5.5% ] 5.27% | 664 | 93.4% |
[ 5.0% - 5.5% ] 5.48% | 420 | 100.0% |
[ 5.5% - 6.0% ] 5.81% | 155 | 100.0% |
[ 5.5% - 6.0% ] 5.92% | 710 | 100.0% |
[ 6.0% - 6.5% ] 6.02% | 1,396 | 94.0% |
[ 6.0% - 6.5% ] 6.15% | 130 | 86.9% |
[ 6.0% - 6.5% ] 6.31% | 301 | 92.6% |
[ 6.5% - 7.0% ] 6.51% | 829 | 97.5% |
[ 6.5% - 7.0% ] 6.73% | 1,307 | 100.0% |
[ 7.5% - 8.0% ] 7.62% | 840 | 100.0% |
[ 12.0% - 12.5% ] 12.33% | 73 | 100.0% |
[ 12.5% - 13.0% ] 12.62% | 301 | 100.0% |
[ 18.0% - 18.5% ] 18.26% | 241 | 100.0% |