Venezuelan 4 or more Vehicles in Household
COMPARE
Venezuelan
Select to Compare
4 or more Vehicles in Household
Venezuelan 4 or more Vehicles in Household
5.3%
4+ VEHICLES AVAILABLE
0.2/ 100
METRIC RATING
288th/ 347
METRIC RANK
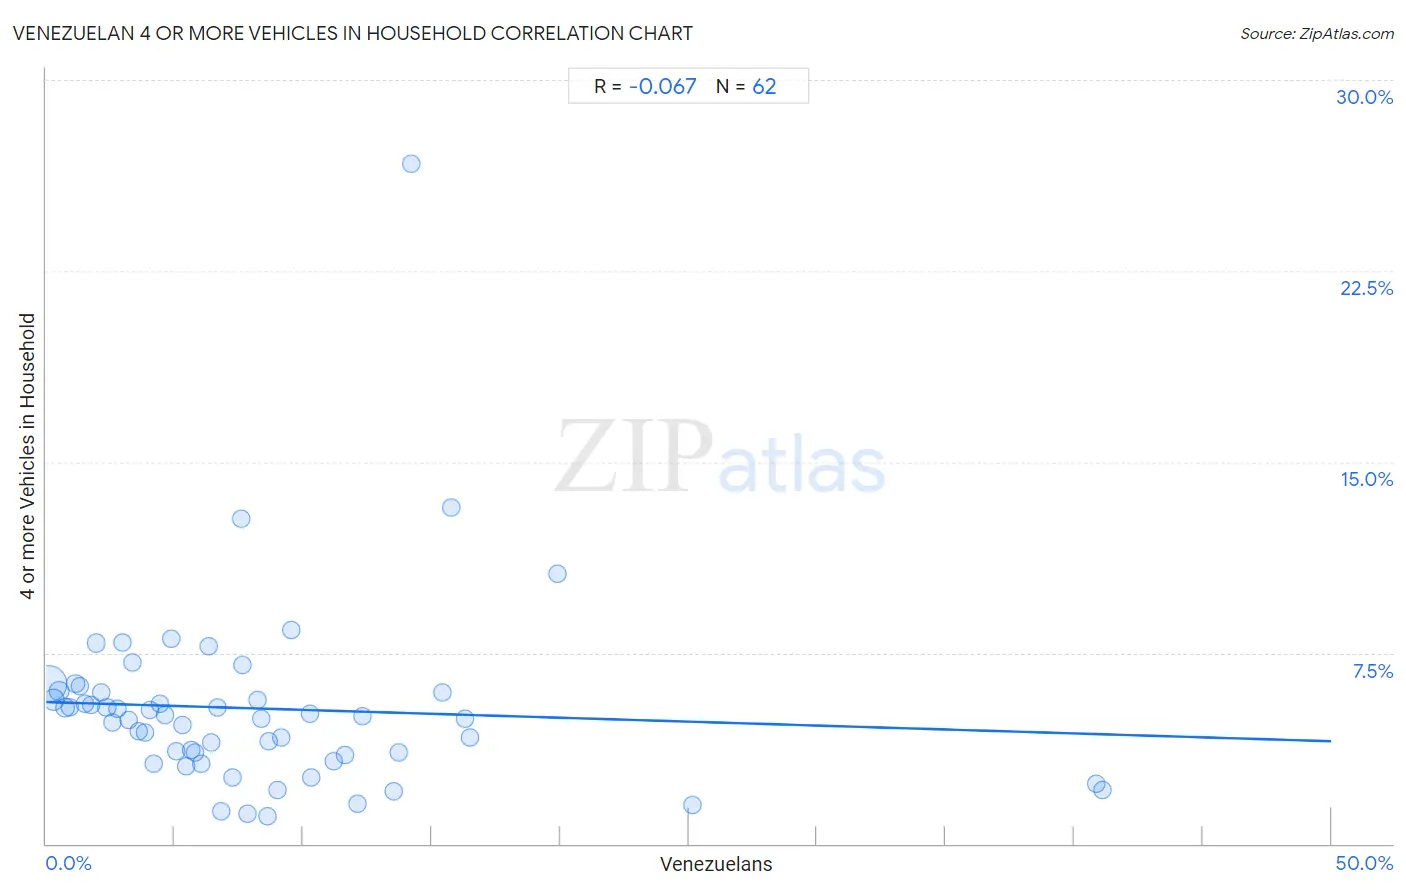
Venezuelan 4 or more Vehicles in Household Correlation Chart
The statistical analysis conducted on geographies consisting of 304,707,736 people shows a slight negative correlation between the proportion of Venezuelans and percentage of households with 4 or more vehicles available in the United States with a correlation coefficient (R) of -0.067 and weighted average of 5.3%. On average, for every 1% (one percent) increase in Venezuelans within a typical geography, there is a decrease of 0.031% in percentage of households with 4 or more vehicles available.
It is essential to understand that the correlation between the percentage of Venezuelans and percentage of households with 4 or more vehicles available does not imply a direct cause-and-effect relationship. It remains uncertain whether the presence of Venezuelans influences an upward or downward trend in the level of percentage of households with 4 or more vehicles available within an area, or if Venezuelans simply ended up residing in those areas with higher or lower levels of percentage of households with 4 or more vehicles available due to other factors.
Demographics Similar to Venezuelans by 4 or more Vehicles in Household
In terms of 4 or more vehicles in household, the demographic groups most similar to Venezuelans are Immigrants from Bosnia and Herzegovina (5.3%, a difference of 0.14%), Immigrants from Croatia (5.4%, a difference of 0.19%), Immigrants from Colombia (5.4%, a difference of 0.28%), Immigrants from Liberia (5.4%, a difference of 0.32%), and Immigrants from Russia (5.3%, a difference of 0.44%).
| Demographics | Rating | Rank | 4 or more Vehicles in Household |
| Immigrants from Western Africa | 0.3 /100 | #281 | Tragic 5.4% |
| Immigrants from Spain | 0.3 /100 | #282 | Tragic 5.4% |
| Immigrants from Ireland | 0.3 /100 | #283 | Tragic 5.4% |
| Brazilians | 0.3 /100 | #284 | Tragic 5.4% |
| Immigrants from Liberia | 0.2 /100 | #285 | Tragic 5.4% |
| Immigrants from Colombia | 0.2 /100 | #286 | Tragic 5.4% |
| Immigrants from Croatia | 0.2 /100 | #287 | Tragic 5.4% |
| Venezuelans | 0.2 /100 | #288 | Tragic 5.3% |
| Immigrants from Bosnia and Herzegovina | 0.2 /100 | #289 | Tragic 5.3% |
| Immigrants from Russia | 0.2 /100 | #290 | Tragic 5.3% |
| Immigrants from Bahamas | 0.1 /100 | #291 | Tragic 5.3% |
| Liberians | 0.1 /100 | #292 | Tragic 5.3% |
| Immigrants from Congo | 0.1 /100 | #293 | Tragic 5.2% |
| Ghanaians | 0.1 /100 | #294 | Tragic 5.2% |
| Immigrants from Brazil | 0.1 /100 | #295 | Tragic 5.2% |
Venezuelan 4 or more Vehicles in Household Correlation Summary
| Measurement | Venezuelan Data | 4 or more Vehicles in Household Data |
| Minimum | 0.089% | 1.1% |
| Maximum | 41.1% | 26.7% |
| Range | 41.0% | 25.6% |
| Mean | 8.2% | 5.3% |
| Median | 6.4% | 5.0% |
| Interquartile 25% (IQ1) | 3.2% | 3.5% |
| Interquartile 75% (IQ3) | 10.3% | 6.0% |
| Interquartile Range (IQR) | 7.1% | 2.5% |
| Standard Deviation (Sample) | 8.0% | 3.7% |
| Standard Deviation (Population) | 7.9% | 3.7% |
Correlation Details
| Venezuelan Percentile | Sample Size | 4 or more Vehicles in Household |
[ 0.0% - 0.5% ] 0.089% | 203,069,122 | 6.3% |
[ 0.0% - 0.5% ] 0.29% | 46,649,750 | 5.7% |
[ 0.5% - 1.0% ] 0.50% | 18,223,381 | 6.0% |
[ 0.5% - 1.0% ] 0.72% | 11,332,853 | 5.3% |
[ 0.5% - 1.0% ] 0.92% | 5,576,854 | 5.3% |
[ 1.0% - 1.5% ] 1.13% | 3,587,927 | 6.3% |
[ 1.0% - 1.5% ] 1.32% | 2,803,296 | 6.2% |
[ 1.5% - 2.0% ] 1.53% | 1,055,031 | 5.5% |
[ 1.5% - 2.0% ] 1.76% | 1,544,089 | 5.5% |
[ 1.5% - 2.0% ] 1.94% | 1,191,448 | 7.9% |
[ 2.0% - 2.5% ] 2.16% | 938,116 | 6.0% |
[ 2.0% - 2.5% ] 2.36% | 1,240,946 | 5.4% |
[ 2.5% - 3.0% ] 2.55% | 705,682 | 4.8% |
[ 2.5% - 3.0% ] 2.79% | 840,624 | 5.3% |
[ 2.5% - 3.0% ] 2.96% | 416,720 | 7.9% |
[ 3.0% - 3.5% ] 3.20% | 310,374 | 4.9% |
[ 3.0% - 3.5% ] 3.36% | 81,962 | 7.1% |
[ 3.5% - 4.0% ] 3.60% | 325,114 | 4.4% |
[ 3.5% - 4.0% ] 3.82% | 291,426 | 4.4% |
[ 4.0% - 4.5% ] 4.02% | 376,445 | 5.3% |
[ 4.0% - 4.5% ] 4.17% | 1,047,638 | 3.1% |
[ 4.0% - 4.5% ] 4.41% | 412,584 | 5.5% |
[ 4.5% - 5.0% ] 4.61% | 383,154 | 5.0% |
[ 4.5% - 5.0% ] 4.86% | 37,842 | 8.0% |
[ 5.0% - 5.5% ] 5.04% | 216,448 | 3.6% |
[ 5.0% - 5.5% ] 5.30% | 229,655 | 4.7% |
[ 5.0% - 5.5% ] 5.44% | 118,501 | 3.0% |
[ 5.5% - 6.0% ] 5.66% | 143,851 | 3.7% |
[ 5.5% - 6.0% ] 5.79% | 56,701 | 3.6% |
[ 6.0% - 6.5% ] 6.02% | 75,101 | 3.2% |
[ 6.0% - 6.5% ] 6.33% | 54,505 | 7.7% |
[ 6.0% - 6.5% ] 6.44% | 71,293 | 4.0% |
[ 6.5% - 7.0% ] 6.68% | 293,556 | 5.3% |
[ 6.5% - 7.0% ] 6.83% | 8,024 | 1.3% |
[ 7.0% - 7.5% ] 7.26% | 55,203 | 2.6% |
[ 7.5% - 8.0% ] 7.58% | 26,692 | 12.8% |
[ 7.5% - 8.0% ] 7.65% | 89,278 | 7.0% |
[ 7.5% - 8.0% ] 7.84% | 40,467 | 1.2% |
[ 8.0% - 8.5% ] 8.21% | 7,316 | 5.6% |
[ 8.0% - 8.5% ] 8.37% | 23,708 | 4.9% |
[ 8.5% - 9.0% ] 8.61% | 1,254 | 1.1% |
[ 8.5% - 9.0% ] 8.67% | 81,643 | 4.0% |
[ 8.5% - 9.0% ] 8.97% | 468 | 2.1% |
[ 9.0% - 9.5% ] 9.13% | 87,095 | 4.2% |
[ 9.5% - 10.0% ] 9.51% | 999 | 8.4% |
[ 10.0% - 10.5% ] 10.25% | 19,895 | 5.1% |
[ 10.0% - 10.5% ] 10.30% | 40,191 | 2.6% |
[ 11.0% - 11.5% ] 11.18% | 121,078 | 3.2% |
[ 11.5% - 12.0% ] 11.61% | 14,557 | 3.5% |
[ 12.0% - 12.5% ] 12.10% | 20,034 | 1.6% |
[ 12.0% - 12.5% ] 12.28% | 26,021 | 5.0% |
[ 13.5% - 14.0% ] 13.53% | 54,464 | 2.1% |
[ 13.5% - 14.0% ] 13.71% | 1,794 | 3.6% |
[ 14.0% - 14.5% ] 14.19% | 1,057 | 26.7% |
[ 15.0% - 15.5% ] 15.42% | 68,029 | 5.9% |
[ 15.5% - 16.0% ] 15.77% | 11,809 | 13.2% |
[ 16.0% - 16.5% ] 16.28% | 31,514 | 4.9% |
[ 16.0% - 16.5% ] 16.50% | 27,124 | 4.2% |
[ 19.5% - 20.0% ] 19.89% | 548 | 10.6% |
[ 25.0% - 25.5% ] 25.14% | 5,843 | 1.5% |
[ 40.5% - 41.0% ] 40.84% | 64,751 | 2.4% |
[ 41.0% - 41.5% ] 41.11% | 74,891 | 2.1% |