Venezuelan College, Under 1 year
COMPARE
Venezuelan
Select to Compare
College, Under 1 year
Venezuelan College, Under 1 year
66.7%
COLLEGE, UNDER 1 YEAR
85.9/ 100
METRIC RATING
139th/ 347
METRIC RANK
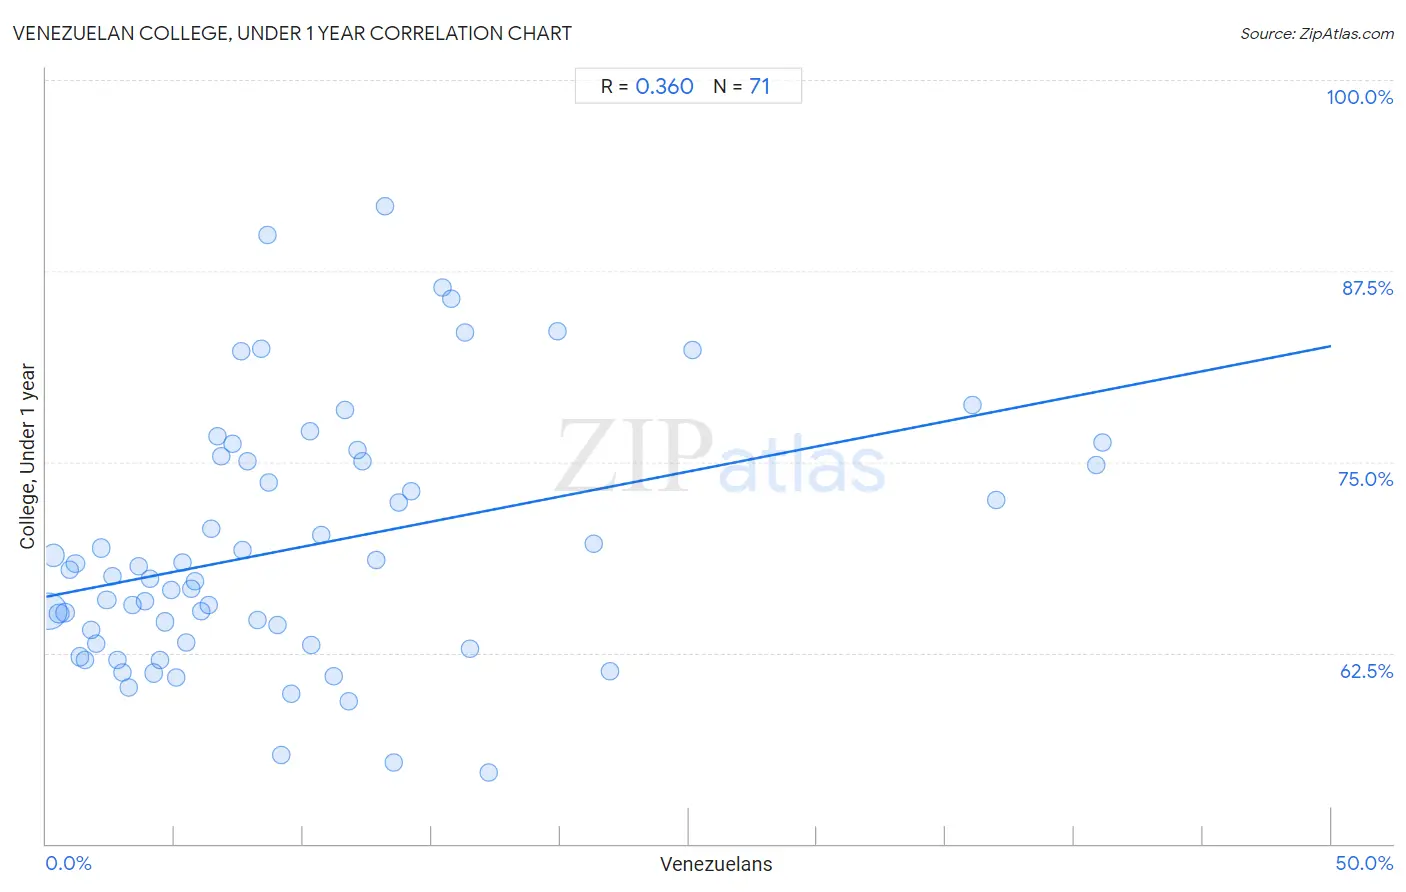
Venezuelan College, Under 1 year Correlation Chart
The statistical analysis conducted on geographies consisting of 306,323,601 people shows a mild positive correlation between the proportion of Venezuelans and percentage of population with at least college, under 1 year education in the United States with a correlation coefficient (R) of 0.360 and weighted average of 66.7%. On average, for every 1% (one percent) increase in Venezuelans within a typical geography, there is an increase of 0.33% in percentage of population with at least college, under 1 year education.
It is essential to understand that the correlation between the percentage of Venezuelans and percentage of population with at least college, under 1 year education does not imply a direct cause-and-effect relationship. It remains uncertain whether the presence of Venezuelans influences an upward or downward trend in the level of percentage of population with at least college, under 1 year education within an area, or if Venezuelans simply ended up residing in those areas with higher or lower levels of percentage of population with at least college, under 1 year education due to other factors.
Demographics Similar to Venezuelans by College, Under 1 year
In terms of college, under 1 year, the demographic groups most similar to Venezuelans are Slavic (66.7%, a difference of 0.0%), Immigrants from Afghanistan (66.7%, a difference of 0.070%), Immigrants from Italy (66.8%, a difference of 0.10%), Immigrants from Chile (66.8%, a difference of 0.14%), and Ugandan (66.8%, a difference of 0.18%).
| Demographics | Rating | Rank | College, Under 1 year |
| Poles | 88.4 /100 | #132 | Excellent 66.9% |
| Immigrants from Brazil | 88.3 /100 | #133 | Excellent 66.9% |
| Iraqis | 88.0 /100 | #134 | Excellent 66.8% |
| Canadians | 87.9 /100 | #135 | Excellent 66.8% |
| Ugandans | 87.8 /100 | #136 | Excellent 66.8% |
| Immigrants from Chile | 87.4 /100 | #137 | Excellent 66.8% |
| Immigrants from Italy | 86.9 /100 | #138 | Excellent 66.8% |
| Venezuelans | 85.9 /100 | #139 | Excellent 66.7% |
| Slavs | 85.9 /100 | #140 | Excellent 66.7% |
| Immigrants from Afghanistan | 85.1 /100 | #141 | Excellent 66.7% |
| English | 82.9 /100 | #142 | Excellent 66.6% |
| Immigrants from Uganda | 82.8 /100 | #143 | Excellent 66.5% |
| Immigrants from Germany | 82.0 /100 | #144 | Excellent 66.5% |
| Immigrants from Kenya | 81.8 /100 | #145 | Excellent 66.5% |
| Kenyans | 81.7 /100 | #146 | Excellent 66.5% |
Venezuelan College, Under 1 year Correlation Summary
| Measurement | Venezuelan Data | College, Under 1 year Data |
| Minimum | 0.089% | 54.6% |
| Maximum | 41.1% | 91.7% |
| Range | 41.0% | 37.1% |
| Mean | 9.8% | 69.4% |
| Median | 7.6% | 67.5% |
| Interquartile 25% (IQ1) | 3.6% | 63.1% |
| Interquartile 75% (IQ3) | 12.9% | 75.1% |
| Interquartile Range (IQR) | 9.3% | 12.0% |
| Standard Deviation (Sample) | 9.1% | 8.3% |
| Standard Deviation (Population) | 9.0% | 8.2% |
Correlation Details
| Venezuelan Percentile | Sample Size | College, Under 1 year |
[ 0.0% - 0.5% ] 0.089% | 203,713,457 | 65.2% |
[ 0.0% - 0.5% ] 0.29% | 47,090,325 | 68.9% |
[ 0.5% - 1.0% ] 0.50% | 18,508,950 | 65.1% |
[ 0.5% - 1.0% ] 0.72% | 11,394,848 | 65.1% |
[ 0.5% - 1.0% ] 0.92% | 5,618,454 | 68.0% |
[ 1.0% - 1.5% ] 1.13% | 3,597,543 | 68.3% |
[ 1.0% - 1.5% ] 1.32% | 2,822,929 | 62.2% |
[ 1.5% - 2.0% ] 1.53% | 1,071,742 | 62.1% |
[ 1.5% - 2.0% ] 1.75% | 1,545,241 | 64.0% |
[ 1.5% - 2.0% ] 1.94% | 1,192,595 | 63.1% |
[ 2.0% - 2.5% ] 2.16% | 939,311 | 69.4% |
[ 2.0% - 2.5% ] 2.36% | 1,244,524 | 65.9% |
[ 2.5% - 3.0% ] 2.55% | 715,434 | 67.5% |
[ 2.5% - 3.0% ] 2.79% | 855,818 | 62.0% |
[ 2.5% - 3.0% ] 2.96% | 416,720 | 61.2% |
[ 3.0% - 3.5% ] 3.20% | 310,593 | 60.2% |
[ 3.0% - 3.5% ] 3.36% | 82,277 | 65.7% |
[ 3.5% - 4.0% ] 3.59% | 334,022 | 68.1% |
[ 3.5% - 4.0% ] 3.82% | 291,426 | 65.9% |
[ 4.0% - 4.5% ] 4.02% | 380,686 | 67.3% |
[ 4.0% - 4.5% ] 4.17% | 1,048,335 | 61.2% |
[ 4.0% - 4.5% ] 4.41% | 414,476 | 62.0% |
[ 4.5% - 5.0% ] 4.61% | 383,154 | 64.5% |
[ 4.5% - 5.0% ] 4.86% | 37,842 | 66.6% |
[ 5.0% - 5.5% ] 5.04% | 216,448 | 60.8% |
[ 5.0% - 5.5% ] 5.30% | 229,655 | 68.4% |
[ 5.0% - 5.5% ] 5.44% | 118,501 | 63.1% |
[ 5.5% - 6.0% ] 5.66% | 143,851 | 66.7% |
[ 5.5% - 6.0% ] 5.79% | 56,701 | 67.2% |
[ 6.0% - 6.5% ] 6.02% | 75,101 | 65.3% |
[ 6.0% - 6.5% ] 6.33% | 54,505 | 65.6% |
[ 6.0% - 6.5% ] 6.44% | 71,293 | 70.6% |
[ 6.5% - 7.0% ] 6.68% | 293,645 | 76.7% |
[ 6.5% - 7.0% ] 6.83% | 8,024 | 75.4% |
[ 7.0% - 7.5% ] 7.26% | 55,203 | 76.2% |
[ 7.5% - 8.0% ] 7.58% | 26,692 | 82.2% |
[ 7.5% - 8.0% ] 7.65% | 89,642 | 69.3% |
[ 7.5% - 8.0% ] 7.84% | 40,467 | 75.1% |
[ 8.0% - 8.5% ] 8.21% | 7,316 | 64.6% |
[ 8.0% - 8.5% ] 8.37% | 23,708 | 82.4% |
[ 8.5% - 9.0% ] 8.61% | 1,254 | 89.8% |
[ 8.5% - 9.0% ] 8.67% | 81,643 | 73.6% |
[ 8.5% - 9.0% ] 8.99% | 690 | 64.3% |
[ 9.0% - 9.5% ] 9.13% | 89,429 | 55.8% |
[ 9.5% - 10.0% ] 9.51% | 999 | 59.9% |
[ 10.0% - 10.5% ] 10.25% | 19,895 | 77.0% |
[ 10.0% - 10.5% ] 10.34% | 57,327 | 63.0% |
[ 10.5% - 11.0% ] 10.71% | 84 | 70.2% |
[ 11.0% - 11.5% ] 11.18% | 121,078 | 60.9% |
[ 11.5% - 12.0% ] 11.61% | 14,557 | 78.4% |
[ 11.5% - 12.0% ] 11.77% | 1,810 | 59.3% |
[ 12.0% - 12.5% ] 12.10% | 20,034 | 75.8% |
[ 12.0% - 12.5% ] 12.28% | 26,021 | 75.0% |
[ 12.5% - 13.0% ] 12.86% | 70 | 68.6% |
[ 13.0% - 13.5% ] 13.17% | 22,540 | 91.7% |
[ 13.5% - 14.0% ] 13.53% | 54,464 | 55.3% |
[ 13.5% - 14.0% ] 13.71% | 1,794 | 72.3% |
[ 14.0% - 14.5% ] 14.19% | 1,057 | 73.1% |
[ 15.0% - 15.5% ] 15.42% | 68,029 | 86.5% |
[ 15.5% - 16.0% ] 15.77% | 11,809 | 85.7% |
[ 16.0% - 16.5% ] 16.28% | 31,514 | 83.5% |
[ 16.0% - 16.5% ] 16.50% | 27,124 | 62.8% |
[ 17.0% - 17.5% ] 17.23% | 383 | 54.6% |
[ 19.5% - 20.0% ] 19.89% | 739 | 83.5% |
[ 21.0% - 21.5% ] 21.29% | 155 | 69.7% |
[ 21.5% - 22.0% ] 21.95% | 41 | 61.3% |
[ 25.0% - 25.5% ] 25.14% | 5,843 | 82.3% |
[ 36.0% - 36.5% ] 36.04% | 1,873 | 78.8% |
[ 36.5% - 37.0% ] 36.95% | 249 | 72.5% |
[ 40.5% - 41.0% ] 40.84% | 64,751 | 74.8% |
[ 41.0% - 41.5% ] 41.11% | 74,891 | 76.3% |