Venezuelan Unemployment Among Women with Children Ages 6 to 17 years

COMPARE

Venezuelan
Race
Ancestry
AfghanAfricanAlaska NativeAlaskan AthabascanAlbanianAleutAlsatianAmericanApacheArabArapahoArgentineanArmenianAssyrian/Chaldean/SyriacAustralianAustrianBahamianBangladeshiBarbadianBasqueBelgianBelizeanBermudanBhutaneseBlackfeetBolivianBrazilianBritishBritish West IndianBulgarianBurmeseCajunCambodianCanadianCape VerdeanCarpatho RusynCelticCentral AmericanCentral American IndianCherokeeCheyenneChickasawChileanChineseChippewaChoctawColombianColvilleComancheCosta RicanCreeCreekCroatianCrowCubanCypriotCzechCzechoslovakianDanishDelawareDominicanDutchDutch West IndianEastern EuropeanEcuadorianEgyptianEnglishEstonianEthiopianEuropeanFijianFilipinoFinnishFrenchFrench American IndianFrench CanadianGermanGerman RussianGhanaianGreekGuamanian/ChamorroGuatemalanGuyaneseHaitianHmongHonduranHopiHoumaHungarianIcelanderIndian (Asian)IndonesianInupiatIranianIraqiIrishIroquoisIsraeliItalianJamaicanJapaneseJordanianKenyanKiowaKoreanLaotianLatvianLebaneseLiberianLithuanianLumbeeLuxembourgerMacedonianMalaysianMalteseMarshalleseMenomineeMexicanMexican American IndianMongolianMoroccanNative HawaiianNavajoNepaleseNew ZealanderNicaraguanNigerianNorthern EuropeanNorwegianOkinawanOsageOttawaPaiutePakistaniPalestinianPanamanianParaguayanPennsylvania GermanPeruvianPimaPolishPortuguesePotawatomiPuebloPuerto RicanPuget Sound SalishRomanianRussianSalvadoranSamoanScandinavianScotch-IrishScottishSeminoleSenegaleseSerbianShoshoneSierra LeoneanSiouxSlavicSlovakSloveneSomaliSouth AfricanSouth AmericanSouth American IndianSoviet UnionSpaniardSpanishSpanish AmericanSpanish American IndianSri LankanSubsaharan AfricanSudaneseSwedishSwissSyrianTaiwaneseThaiTlingit-HaidaTohono O'OdhamTonganTrinidadian and TobagonianTsimshianTurkishU.S. Virgin IslanderUgandanUkrainianUruguayanUteVenezuelanVietnameseWelshWest IndianYakamaYaquiYugoslavianYumanYup'ikZimbabwean
Immigration
NonimmigrantsImmigrantsAfghanistanAfricaAlbaniaArgentinaArmeniaAsiaAustraliaAustriaBahamasBangladeshBarbadosBelarusBelgiumBelizeBoliviaBosnia and HerzegovinaBrazilBulgariaBurma/MyanmarCabo VerdeCambodiaCameroonCanadaCaribbeanCentral AmericaChileChinaColombiaCongoCosta RicaCroatiaCubaCzechoslovakiaDenmarkDominicaDominican RepublicEastern AfricaEastern AsiaEastern EuropeEcuadorEgyptEl SalvadorEnglandEritreaEthiopiaEuropeFijiFranceGermanyGhanaGreeceGrenadaGuatemalaGuyanaHaitiHondurasHong KongHungaryIndiaIndonesiaIranIraqIrelandIsraelItalyJamaicaJapanJordanKazakhstanKenyaKoreaKuwaitLaosLatin AmericaLatviaLebanonLiberiaLithuaniaMalaysiaMexicoMicronesiaMiddle AfricaMoldovaMoroccoNepalNetherlandsNicaraguaNigeriaNorth AmericaNorth MacedoniaNorthern AfricaNorthern EuropeNorwayOceaniaPakistanPanamaPeruPhilippinesPolandPortugalRomaniaRussiaSaudi ArabiaScotlandSenegalSerbiaSierra LeoneSingaporeSomaliaSouth AfricaSouth AmericaSouth Central AsiaSouth Eastern AsiaSouthern EuropeSpainSri LankaSt. Vincent and the GrenadinesSudanSwedenSwitzerlandSyriaTaiwanThailandTrinidad and TobagoTurkeyUgandaUkraineUruguayUzbekistanVenezuelaVietnamWest IndiesWestern AfricaWestern AsiaWestern EuropeYemenZaireZimbabweAzores
Select to Compare
Race
Ancestry
AfghanAfricanAlaska NativeAlaskan AthabascanAlbanianAleutAlsatianAmericanApacheArabArapahoArgentineanArmenianAssyrian/Chaldean/SyriacAustralianAustrianBahamianBangladeshiBarbadianBasqueBelgianBelizeanBermudanBhutaneseBlackfeetBolivianBrazilianBritishBritish West IndianBulgarianBurmeseCajunCambodianCanadianCape VerdeanCarpatho RusynCelticCentral AmericanCentral American IndianCherokeeCheyenneChickasawChileanChineseChippewaChoctawColombianColvilleComancheCosta RicanCreeCreekCroatianCrowCubanCypriotCzechCzechoslovakianDanishDelawareDominicanDutchDutch West IndianEastern EuropeanEcuadorianEgyptianEnglishEstonianEthiopianEuropeanFijianFilipinoFinnishFrenchFrench American IndianFrench CanadianGermanGerman RussianGhanaianGreekGuamanian/ChamorroGuatemalanGuyaneseHaitianHmongHonduranHopiHoumaHungarianIcelanderIndian (Asian)IndonesianInupiatIranianIraqiIrishIroquoisIsraeliItalianJamaicanJapaneseJordanianKenyanKiowaKoreanLaotianLatvianLebaneseLiberianLithuanianLumbeeLuxembourgerMacedonianMalaysianMalteseMarshalleseMenomineeMexicanMexican American IndianMongolianMoroccanNative HawaiianNavajoNepaleseNew ZealanderNicaraguanNigerianNorthern EuropeanNorwegianOkinawanOsageOttawaPaiutePakistaniPalestinianPanamanianParaguayanPennsylvania GermanPeruvianPimaPolishPortuguesePotawatomiPuebloPuerto RicanPuget Sound SalishRomanianRussianSalvadoranSamoanScandinavianScotch-IrishScottishSeminoleSenegaleseSerbianShoshoneSierra LeoneanSiouxSlavicSlovakSloveneSomaliSouth AfricanSouth AmericanSouth American IndianSoviet UnionSpaniardSpanishSpanish AmericanSpanish American IndianSri LankanSubsaharan AfricanSudaneseSwedishSwissSyrianTaiwaneseThaiTlingit-HaidaTohono O'OdhamTonganTrinidadian and TobagonianTsimshianTurkishU.S. Virgin IslanderUgandanUkrainianUruguayanUteVietnameseWelshWest IndianYakamaYaquiYugoslavianYumanYup'ikZimbabwean
Immigration
NonimmigrantsImmigrantsAfghanistanAfricaAlbaniaArgentinaArmeniaAsiaAustraliaAustriaBahamasBangladeshBarbadosBelarusBelgiumBelizeBoliviaBosnia and HerzegovinaBrazilBulgariaBurma/MyanmarCabo VerdeCambodiaCameroonCanadaCaribbeanCentral AmericaChileChinaColombiaCongoCosta RicaCroatiaCubaCzechoslovakiaDenmarkDominicaDominican RepublicEastern AfricaEastern AsiaEastern EuropeEcuadorEgyptEl SalvadorEnglandEritreaEthiopiaEuropeFijiFranceGermanyGhanaGreeceGrenadaGuatemalaGuyanaHaitiHondurasHong KongHungaryIndiaIndonesiaIranIraqIrelandIsraelItalyJamaicaJapanJordanKazakhstanKenyaKoreaKuwaitLaosLatin AmericaLatviaLebanonLiberiaLithuaniaMalaysiaMexicoMicronesiaMiddle AfricaMoldovaMoroccoNepalNetherlandsNicaraguaNigeriaNorth AmericaNorth MacedoniaNorthern AfricaNorthern EuropeNorwayOceaniaPakistanPanamaPeruPhilippinesPolandPortugalRomaniaRussiaSaudi ArabiaScotlandSenegalSerbiaSierra LeoneSingaporeSomaliaSouth AfricaSouth AmericaSouth Central AsiaSouth Eastern AsiaSouthern EuropeSpainSri LankaSt. Vincent and the GrenadinesSudanSwedenSwitzerlandSyriaTaiwanThailandTrinidad and TobagoTurkeyUgandaUkraineUruguayUzbekistanVenezuelaVietnamWest IndiesWestern AfricaWestern AsiaWestern EuropeYemenZaireZimbabweAzores
Unemployment Among Women with Children Ages 6 to 17 years
Income
Poverty
Unemployment
Labor Participation
Family Structure
Vehicle Availability
Education Level
Disability

Venezuelan Unemployment Among Women with Children Ages 6 to 17 years
Tragic

10.2%
UNEMPLOYMENT | WOMEN W/ CHILDREN 6 TO 17
0.0/ 100
METRIC RATING
302nd/ 347
METRIC RANK

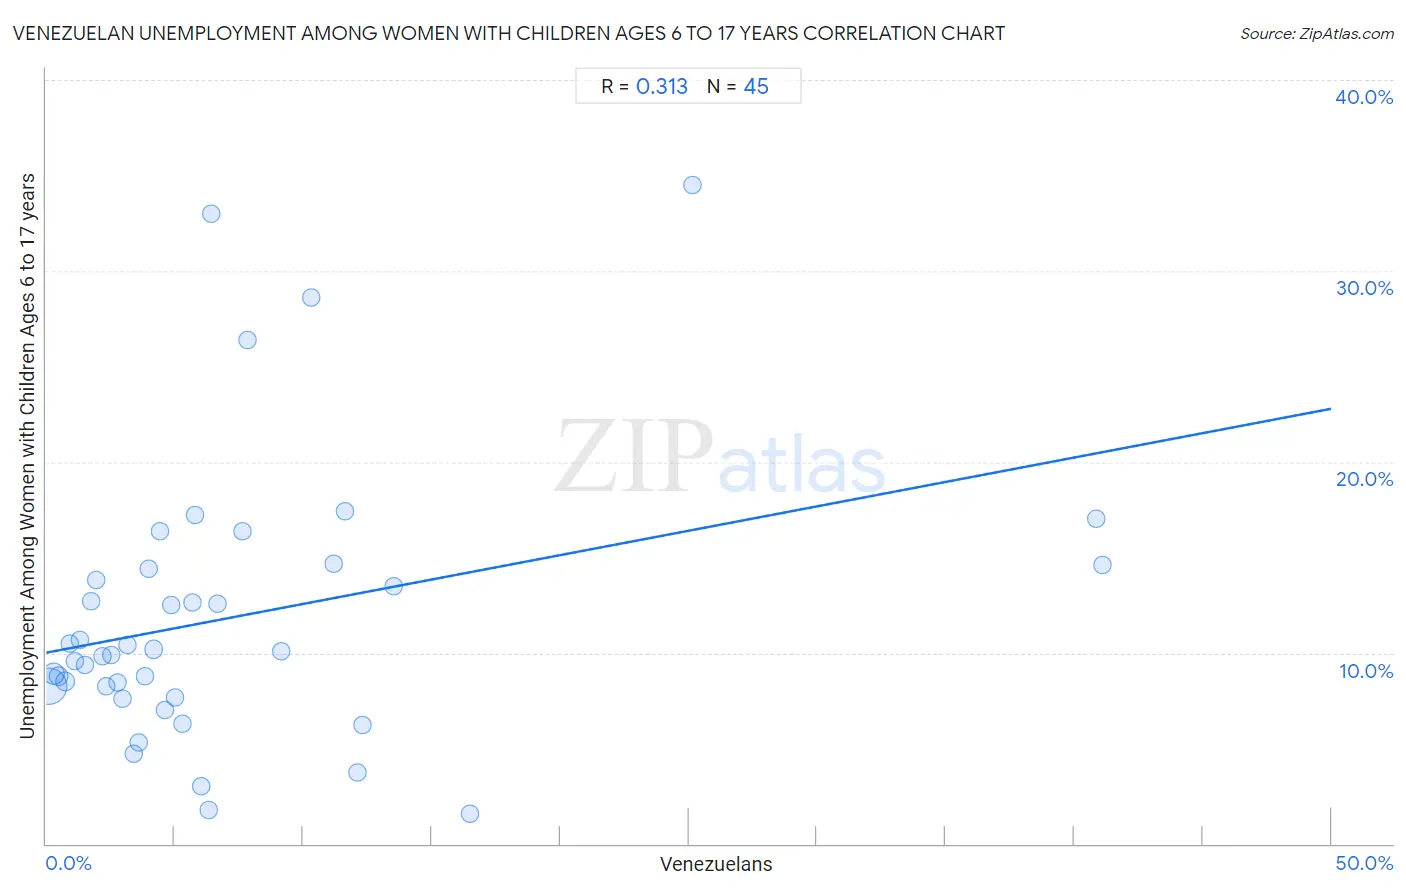
Venezuelan Unemployment Among Women with Children Ages 6 to 17 years Correlation Chart

The statistical analysis conducted on geographies consisting of 232,836,093 people shows a mild positive correlation between the proportion of Venezuelans and unemployment rate among women with children between the ages 6 and 17 in the United States with a correlation coefficient (R) of 0.313 and weighted average of 10.2%. On average, for every 1% (one percent) increase in Venezuelans within a typical geography, there is an increase of 0.26% in unemployment rate among women with children between the ages 6 and 17.
Venezuelan Unemployment Among Women with Children Ages 6 to 17 years
It is essential to understand that the correlation between the percentage of Venezuelans and unemployment rate among women with children between the ages 6 and 17 does not imply a direct cause-and-effect relationship. It remains uncertain whether the presence of Venezuelans influences an upward or downward trend in the level of unemployment rate among women with children between the ages 6 and 17 within an area, or if Venezuelans simply ended up residing in those areas with higher or lower levels of unemployment rate among women with children between the ages 6 and 17 due to other factors.

Demographics Similar to Venezuelans by Unemployment Among Women with Children Ages 6 to 17 years

In terms of unemployment among women with children ages 6 to 17 years, the demographic groups most similar to Venezuelans are Immigrants from Ecuador (10.2%, a difference of 0.17%), Immigrants from Venezuela (10.2%, a difference of 0.27%), Immigrants from Nigeria (10.2%, a difference of 0.32%), Immigrants from Bahamas (10.1%, a difference of 0.45%), and Nigerian (10.1%, a difference of 0.60%).
DemographicsRating | RankUnemployment Among Women with Children Ages 6 to 17 years
Cherokee
0.0
/100
|
#295
Tragic
10.0%
Immigrants from Western Africa
0.0
/100
|
#296
Tragic
10.1%
Immigrants from Caribbean
0.0
/100
|
#297
Tragic
10.1%
Immigrants from Haiti
0.0
/100
|
#298
Tragic
10.1%
Immigrants from Honduras
0.0
/100
|
#299
Tragic
10.1%
Nigerians
0.0
/100
|
#300
Tragic
10.1%
Immigrants from Bahamas
0.0
/100
|
#301
Tragic
10.1%
Venezuelans
0.0
/100
|
#302
Tragic
10.2%
Immigrants from Ecuador
0.0
/100
|
#303
Tragic
10.2%
Immigrants from Venezuela
0.0
/100
|
#304
Tragic
10.2%
Immigrants from Nigeria
0.0
/100
|
#305
Tragic
10.2%
Paraguayans
0.0
/100
|
#306
Tragic
10.2%
Immigrants from Senegal
0.0
/100
|
#307
Tragic
10.2%
Dutch West Indians
0.0
/100
|
#308
Tragic
10.2%
French Canadians
0.0
/100
|
#309
Tragic
10.3%

Venezuelan Unemployment Among Women with Children Ages 6 to 17 years Correlation Summary

MeasurementVenezuelan DataUnemployment Among Women with Children Ages 6 to 17 years Data
Minimum0.089%1.6%
Maximum41.1%34.5%
Range41.0%32.9%
Mean7.2%11.9%
Median4.6%10.1%
Interquartile 25% (IQ1)2.3%7.9%
Interquartile 75% (IQ3)8.5%14.5%
Interquartile Range (IQR)6.2%6.6%
Standard Deviation (Sample)8.8%7.2%
Standard Deviation (Population)8.7%7.1%

Correlation Details

Venezuelan PercentileSample SizeUnemployment Among Women with Children Ages 6 to 17 years
[
0.0%
-
0.5%
]
0.089%
163,015,3078.2%
[
0.0%
-
0.5%
]
0.29%
33,452,1638.9%
[
0.0%
-
0.5%
]
0.50%
12,653,5698.8%
[
0.5%
-
1.0%
]
0.73%
8,103,6528.5%
[
0.5%
-
1.0%
]
0.92%
3,604,17910.5%
[
1.0%
-
1.5%
]
1.13%
2,294,5569.6%
[
1.0%
-
1.5%
]
1.31%
1,677,59410.7%
[
1.5%
-
2.0%
]
1.52%
664,2969.3%
[
1.5%
-
2.0%
]
1.75%
942,92812.7%
[
1.5%
-
2.0%
]
1.95%
547,96313.8%
[
2.0%
-
2.5%
]
2.18%
405,5479.8%
[
2.0%
-
2.5%
]
2.35%
722,0298.3%
[
2.5%
-
3.0%
]
2.55%
431,3279.9%
[
2.5%
-
3.0%
]
2.78%
435,0868.4%
[
2.5%
-
3.0%
]
2.95%
204,1927.6%
[
3.0%
-
3.5%
]
3.18%
171,97610.4%
[
3.0%
-
3.5%
]
3.39%
1,8294.7%
[
3.5%
-
4.0%
]
3.59%
240,7015.3%
[
3.5%
-
4.0%
]
3.82%
290,4088.8%
[
3.5%
-
4.0%
]
4.00%
197,31714.4%
[
4.0%
-
4.5%
]
4.16%
926,68110.2%
[
4.0%
-
4.5%
]
4.41%
375,35816.3%
[
4.5%
-
5.0%
]
4.62%
190,9207.0%
[
4.5%
-
5.0%
]
4.88%
31,54612.5%
[
5.0%
-
5.5%
]
5.03%
150,5337.6%
[
5.0%
-
5.5%
]
5.32%
99,0566.3%
[
5.5%
-
6.0%
]
5.67%
51,78212.6%
[
5.5%
-
6.0%
]
5.78%
28,97817.2%
[
6.0%
-
6.5%
]
6.01%
26,8143.0%
[
6.0%
-
6.5%
]
6.33%
54,1871.8%
[
6.0%
-
6.5%
]
6.43%
29,22833.0%
[
6.5%
-
7.0%
]
6.68%
226,74412.6%
[
7.5%
-
8.0%
]
7.64%
59,42616.4%
[
7.5%
-
8.0%
]
7.82%
25,28326.4%
[
9.0%
-
9.5%
]
9.12%
78,47810.1%
[
10.0%
-
10.5%
]
10.30%
40,19128.6%
[
11.0%
-
11.5%
]
11.18%
97,34414.6%
[
11.5%
-
12.0%
]
11.61%
14,55717.4%
[
12.0%
-
12.5%
]
12.10%
20,0343.7%
[
12.0%
-
12.5%
]
12.28%
26,0216.2%
[
13.5%
-
14.0%
]
13.53%
54,46413.5%
[
16.0%
-
16.5%
]
16.50%
26,3641.6%
[
25.0%
-
25.5%
]
25.14%
5,84334.5%
[
40.5%
-
41.0%
]
40.84%
64,75117.0%
[
41.0%
-
41.5%
]
41.11%
74,89114.6%