Venezuelan Self-Care Disability
COMPARE
Venezuelan
Select to Compare
Self-Care Disability
Venezuelan Self-Care Disability
2.2%
SELF-CARE DISABILITY
99.9/ 100
METRIC RATING
27th/ 347
METRIC RANK
Venezuelan Self-Care Disability Correlation Chart
The statistical analysis conducted on geographies consisting of 306,028,840 people shows a slight positive correlation between the proportion of Venezuelans and percentage of population with self-care disability in the United States with a correlation coefficient (R) of 0.096 and weighted average of 2.2%. On average, for every 1% (one percent) increase in Venezuelans within a typical geography, there is an increase of 0.013% in percentage of population with self-care disability.
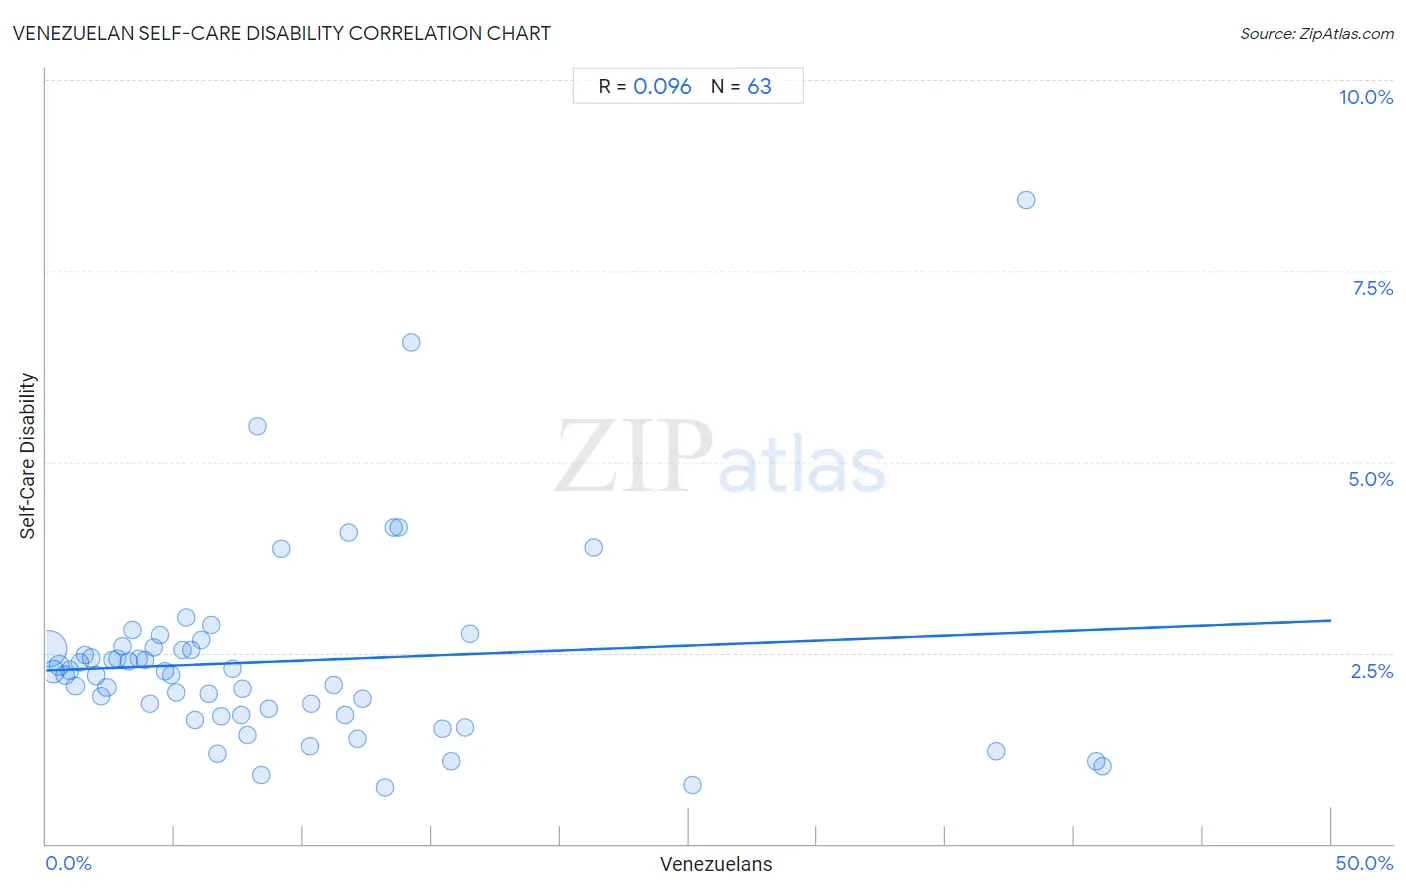
It is essential to understand that the correlation between the percentage of Venezuelans and percentage of population with self-care disability does not imply a direct cause-and-effect relationship. It remains uncertain whether the presence of Venezuelans influences an upward or downward trend in the level of percentage of population with self-care disability within an area, or if Venezuelans simply ended up residing in those areas with higher or lower levels of percentage of population with self-care disability due to other factors.
Demographics Similar to Venezuelans by Self-Care Disability
In terms of self-care disability, the demographic groups most similar to Venezuelans are Immigrants from Sri Lanka (2.2%, a difference of 0.010%), Turkish (2.2%, a difference of 0.080%), Inupiat (2.2%, a difference of 0.16%), Cypriot (2.2%, a difference of 0.19%), and Immigrants from Zimbabwe (2.3%, a difference of 0.25%).
| Demographics | Rating | Rank | Self-Care Disability |
| Tongans | 100.0 /100 | #20 | Exceptional 2.2% |
| Bulgarians | 100.0 /100 | #21 | Exceptional 2.2% |
| Immigrants from Venezuela | 100.0 /100 | #22 | Exceptional 2.2% |
| Cambodians | 100.0 /100 | #23 | Exceptional 2.2% |
| Cypriots | 100.0 /100 | #24 | Exceptional 2.2% |
| Turks | 100.0 /100 | #25 | Exceptional 2.2% |
| Immigrants from Sri Lanka | 99.9 /100 | #26 | Exceptional 2.2% |
| Venezuelans | 99.9 /100 | #27 | Exceptional 2.2% |
| Inupiat | 99.9 /100 | #28 | Exceptional 2.2% |
| Immigrants from Zimbabwe | 99.9 /100 | #29 | Exceptional 2.3% |
| Paraguayans | 99.9 /100 | #30 | Exceptional 2.3% |
| Danes | 99.9 /100 | #31 | Exceptional 2.3% |
| Burmese | 99.9 /100 | #32 | Exceptional 2.3% |
| Immigrants from Korea | 99.9 /100 | #33 | Exceptional 2.3% |
| Immigrants from Turkey | 99.9 /100 | #34 | Exceptional 2.3% |
Venezuelan Self-Care Disability Correlation Summary
| Measurement | Venezuelan Data | Self-Care Disability Data |
| Minimum | 0.089% | 0.74% |
| Maximum | 41.1% | 8.4% |
| Range | 41.0% | 7.7% |
| Mean | 9.3% | 2.4% |
| Median | 6.4% | 2.3% |
| Interquartile 25% (IQ1) | 3.2% | 1.7% |
| Interquartile 75% (IQ3) | 12.1% | 2.6% |
| Interquartile Range (IQR) | 8.9% | 0.90% |
| Standard Deviation (Sample) | 9.5% | 1.3% |
| Standard Deviation (Population) | 9.4% | 1.3% |
Correlation Details
| Venezuelan Percentile | Sample Size | Self-Care Disability |
[ 0.0% - 0.5% ] 0.089% | 203,610,390 | 2.5% |
[ 0.0% - 0.5% ] 0.29% | 47,005,348 | 2.3% |
[ 0.5% - 1.0% ] 0.50% | 18,462,701 | 2.3% |
[ 0.5% - 1.0% ] 0.72% | 11,379,285 | 2.2% |
[ 0.5% - 1.0% ] 0.92% | 5,617,528 | 2.3% |
[ 1.0% - 1.5% ] 1.13% | 3,590,419 | 2.1% |
[ 1.0% - 1.5% ] 1.32% | 2,820,446 | 2.4% |
[ 1.5% - 2.0% ] 1.53% | 1,058,657 | 2.5% |
[ 1.5% - 2.0% ] 1.76% | 1,543,923 | 2.4% |
[ 1.5% - 2.0% ] 1.94% | 1,191,027 | 2.2% |
[ 2.0% - 2.5% ] 2.16% | 939,311 | 1.9% |
[ 2.0% - 2.5% ] 2.36% | 1,243,792 | 2.0% |
[ 2.5% - 3.0% ] 2.55% | 714,955 | 2.4% |
[ 2.5% - 3.0% ] 2.79% | 854,055 | 2.4% |
[ 2.5% - 3.0% ] 2.96% | 414,981 | 2.6% |
[ 3.0% - 3.5% ] 3.20% | 310,593 | 2.4% |
[ 3.0% - 3.5% ] 3.36% | 82,277 | 2.8% |
[ 3.5% - 4.0% ] 3.59% | 331,864 | 2.4% |
[ 3.5% - 4.0% ] 3.82% | 291,426 | 2.4% |
[ 4.0% - 4.5% ] 4.02% | 380,686 | 1.8% |
[ 4.0% - 4.5% ] 4.17% | 1,048,335 | 2.6% |
[ 4.0% - 4.5% ] 4.41% | 412,584 | 2.7% |
[ 4.5% - 5.0% ] 4.61% | 382,467 | 2.3% |
[ 4.5% - 5.0% ] 4.86% | 37,842 | 2.2% |
[ 5.0% - 5.5% ] 5.04% | 216,448 | 2.0% |
[ 5.0% - 5.5% ] 5.30% | 229,655 | 2.5% |
[ 5.0% - 5.5% ] 5.44% | 118,501 | 3.0% |
[ 5.5% - 6.0% ] 5.66% | 143,225 | 2.5% |
[ 5.5% - 6.0% ] 5.79% | 56,701 | 1.6% |
[ 6.0% - 6.5% ] 6.02% | 75,101 | 2.7% |
[ 6.0% - 6.5% ] 6.33% | 54,187 | 2.0% |
[ 6.0% - 6.5% ] 6.44% | 71,293 | 2.9% |
[ 6.5% - 7.0% ] 6.68% | 293,556 | 1.2% |
[ 6.5% - 7.0% ] 6.83% | 8,024 | 1.7% |
[ 7.0% - 7.5% ] 7.26% | 55,203 | 2.3% |
[ 7.5% - 8.0% ] 7.58% | 25,418 | 1.7% |
[ 7.5% - 8.0% ] 7.65% | 89,642 | 2.0% |
[ 7.5% - 8.0% ] 7.84% | 40,467 | 1.4% |
[ 8.0% - 8.5% ] 8.21% | 7,316 | 5.5% |
[ 8.0% - 8.5% ] 8.37% | 23,708 | 0.90% |
[ 8.5% - 9.0% ] 8.67% | 81,643 | 1.8% |
[ 9.0% - 9.5% ] 9.13% | 89,429 | 3.9% |
[ 10.0% - 10.5% ] 10.25% | 19,895 | 1.3% |
[ 10.0% - 10.5% ] 10.34% | 57,327 | 1.8% |
[ 11.0% - 11.5% ] 11.18% | 121,078 | 2.1% |
[ 11.5% - 12.0% ] 11.61% | 14,557 | 1.7% |
[ 11.5% - 12.0% ] 11.77% | 1,810 | 4.1% |
[ 12.0% - 12.5% ] 12.10% | 20,034 | 1.4% |
[ 12.0% - 12.5% ] 12.28% | 26,021 | 1.9% |
[ 13.0% - 13.5% ] 13.17% | 22,540 | 0.74% |
[ 13.5% - 14.0% ] 13.53% | 54,464 | 4.1% |
[ 13.5% - 14.0% ] 13.71% | 1,794 | 4.1% |
[ 14.0% - 14.5% ] 14.19% | 1,057 | 6.6% |
[ 15.0% - 15.5% ] 15.42% | 68,029 | 1.5% |
[ 15.5% - 16.0% ] 15.77% | 11,809 | 1.1% |
[ 16.0% - 16.5% ] 16.28% | 31,514 | 1.5% |
[ 16.0% - 16.5% ] 16.50% | 26,364 | 2.7% |
[ 21.0% - 21.5% ] 21.29% | 155 | 3.9% |
[ 25.0% - 25.5% ] 25.14% | 5,843 | 0.77% |
[ 36.5% - 37.0% ] 36.95% | 249 | 1.2% |
[ 38.0% - 38.5% ] 38.15% | 249 | 8.4% |
[ 40.5% - 41.0% ] 40.84% | 64,751 | 1.1% |
[ 41.0% - 41.5% ] 41.11% | 74,891 | 1.0% |