Venezuelan 1 or more Vehicles in Household
COMPARE
Venezuelan
Select to Compare
1 or more Vehicles in Household
Venezuelan 1 or more Vehicles in Household
91.9%
1+ VEHICLES AVAILABLE
99.8/ 100
METRIC RATING
59th/ 347
METRIC RANK
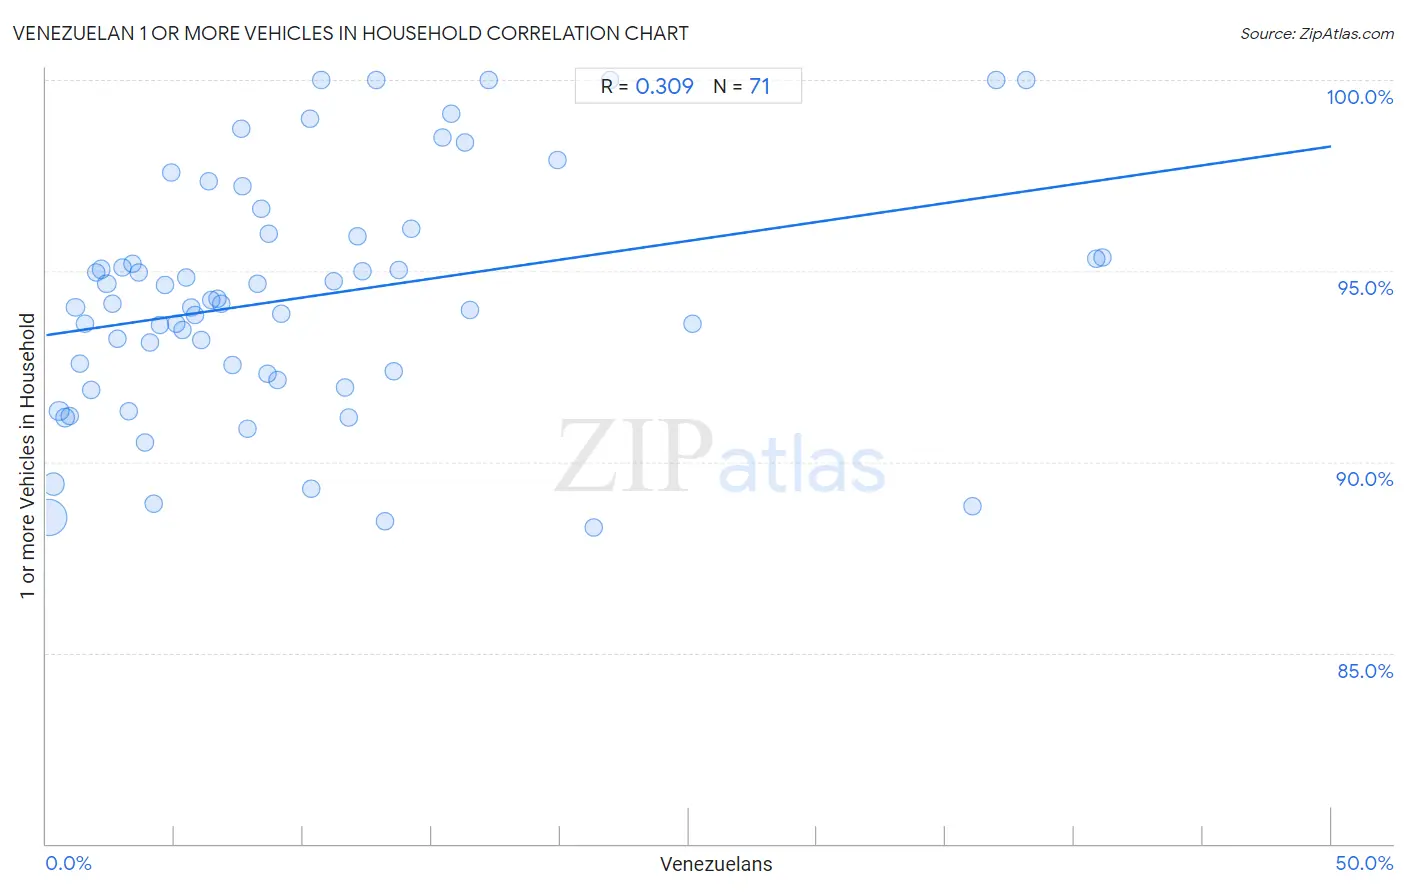
Venezuelan 1 or more Vehicles in Household Correlation Chart
The statistical analysis conducted on geographies consisting of 306,174,989 people shows a mild positive correlation between the proportion of Venezuelans and percentage of households with 1 or more vehicles available in the United States with a correlation coefficient (R) of 0.309 and weighted average of 91.9%. On average, for every 1% (one percent) increase in Venezuelans within a typical geography, there is an increase of 0.099% in percentage of households with 1 or more vehicles available.
It is essential to understand that the correlation between the percentage of Venezuelans and percentage of households with 1 or more vehicles available does not imply a direct cause-and-effect relationship. It remains uncertain whether the presence of Venezuelans influences an upward or downward trend in the level of percentage of households with 1 or more vehicles available within an area, or if Venezuelans simply ended up residing in those areas with higher or lower levels of percentage of households with 1 or more vehicles available due to other factors.
Demographics Similar to Venezuelans by 1 or more Vehicles in Household
In terms of 1 or more vehicles in household, the demographic groups most similar to Venezuelans are Immigrants from Mexico (91.9%, a difference of 0.010%), Iraqi (91.9%, a difference of 0.030%), Slovak (91.9%, a difference of 0.030%), Immigrants from India (91.9%, a difference of 0.040%), and Thai (91.9%, a difference of 0.040%).
| Demographics | Rating | Rank | 1 or more Vehicles in Household |
| Koreans | 99.9 /100 | #52 | Exceptional 92.1% |
| Hawaiians | 99.9 /100 | #53 | Exceptional 92.0% |
| Slovenes | 99.9 /100 | #54 | Exceptional 92.0% |
| Immigrants from Afghanistan | 99.9 /100 | #55 | Exceptional 92.0% |
| Immigrants from Venezuela | 99.9 /100 | #56 | Exceptional 92.0% |
| Iraqis | 99.8 /100 | #57 | Exceptional 91.9% |
| Immigrants from Mexico | 99.8 /100 | #58 | Exceptional 91.9% |
| Venezuelans | 99.8 /100 | #59 | Exceptional 91.9% |
| Slovaks | 99.8 /100 | #60 | Exceptional 91.9% |
| Immigrants from India | 99.8 /100 | #61 | Exceptional 91.9% |
| Thais | 99.8 /100 | #62 | Exceptional 91.9% |
| Chinese | 99.8 /100 | #63 | Exceptional 91.9% |
| Croatians | 99.8 /100 | #64 | Exceptional 91.9% |
| Immigrants from Laos | 99.8 /100 | #65 | Exceptional 91.8% |
| Canadians | 99.8 /100 | #66 | Exceptional 91.8% |
Venezuelan 1 or more Vehicles in Household Correlation Summary
| Measurement | Venezuelan Data | 1 or more Vehicles in Household Data |
| Minimum | 0.089% | 88.3% |
| Maximum | 41.1% | 100.0% |
| Range | 41.0% | 11.7% |
| Mean | 10.2% | 94.3% |
| Median | 7.6% | 94.2% |
| Interquartile 25% (IQ1) | 3.6% | 92.3% |
| Interquartile 75% (IQ3) | 13.2% | 96.0% |
| Interquartile Range (IQR) | 9.6% | 3.7% |
| Standard Deviation (Sample) | 9.7% | 3.1% |
| Standard Deviation (Population) | 9.6% | 3.1% |
Correlation Details
| Venezuelan Percentile | Sample Size | 1 or more Vehicles in Household |
[ 0.0% - 0.5% ] 0.089% | 203,662,886 | 88.5% |
[ 0.0% - 0.5% ] 0.29% | 47,044,295 | 89.4% |
[ 0.5% - 1.0% ] 0.50% | 18,493,203 | 91.3% |
[ 0.5% - 1.0% ] 0.72% | 11,383,907 | 91.2% |
[ 0.5% - 1.0% ] 0.92% | 5,616,427 | 91.2% |
[ 1.0% - 1.5% ] 1.13% | 3,590,419 | 94.1% |
[ 1.0% - 1.5% ] 1.32% | 2,821,278 | 92.6% |
[ 1.5% - 2.0% ] 1.53% | 1,061,221 | 93.6% |
[ 1.5% - 2.0% ] 1.76% | 1,544,089 | 91.9% |
[ 1.5% - 2.0% ] 1.94% | 1,192,595 | 95.0% |
[ 2.0% - 2.5% ] 2.16% | 939,311 | 95.0% |
[ 2.0% - 2.5% ] 2.36% | 1,244,271 | 94.7% |
[ 2.5% - 3.0% ] 2.55% | 714,955 | 94.2% |
[ 2.5% - 3.0% ] 2.79% | 855,818 | 93.2% |
[ 2.5% - 3.0% ] 2.96% | 416,720 | 95.1% |
[ 3.0% - 3.5% ] 3.20% | 310,593 | 91.3% |
[ 3.0% - 3.5% ] 3.36% | 82,277 | 95.2% |
[ 3.5% - 4.0% ] 3.59% | 332,619 | 95.0% |
[ 3.5% - 4.0% ] 3.82% | 291,426 | 90.5% |
[ 4.0% - 4.5% ] 4.02% | 380,686 | 93.1% |
[ 4.0% - 4.5% ] 4.17% | 1,048,335 | 88.9% |
[ 4.0% - 4.5% ] 4.41% | 414,476 | 93.6% |
[ 4.5% - 5.0% ] 4.61% | 383,154 | 94.6% |
[ 4.5% - 5.0% ] 4.86% | 37,842 | 97.6% |
[ 5.0% - 5.5% ] 5.04% | 216,448 | 93.6% |
[ 5.0% - 5.5% ] 5.30% | 229,655 | 93.5% |
[ 5.0% - 5.5% ] 5.44% | 118,501 | 94.8% |
[ 5.5% - 6.0% ] 5.66% | 143,851 | 94.0% |
[ 5.5% - 6.0% ] 5.79% | 56,701 | 93.8% |
[ 6.0% - 6.5% ] 6.02% | 75,101 | 93.2% |
[ 6.0% - 6.5% ] 6.33% | 54,505 | 97.4% |
[ 6.0% - 6.5% ] 6.44% | 71,293 | 94.2% |
[ 6.5% - 7.0% ] 6.68% | 293,645 | 94.3% |
[ 6.5% - 7.0% ] 6.83% | 8,024 | 94.1% |
[ 7.0% - 7.5% ] 7.26% | 55,203 | 92.5% |
[ 7.5% - 8.0% ] 7.58% | 26,692 | 98.7% |
[ 7.5% - 8.0% ] 7.65% | 89,642 | 97.2% |
[ 7.5% - 8.0% ] 7.84% | 40,467 | 90.9% |
[ 8.0% - 8.5% ] 8.21% | 7,353 | 94.7% |
[ 8.0% - 8.5% ] 8.37% | 23,708 | 96.6% |
[ 8.5% - 9.0% ] 8.61% | 1,254 | 92.3% |
[ 8.5% - 9.0% ] 8.67% | 81,643 | 96.0% |
[ 8.5% - 9.0% ] 8.99% | 690 | 92.2% |
[ 9.0% - 9.5% ] 9.13% | 89,429 | 93.9% |
[ 10.0% - 10.5% ] 10.25% | 19,895 | 99.0% |
[ 10.0% - 10.5% ] 10.34% | 57,327 | 89.3% |
[ 10.5% - 11.0% ] 10.71% | 84 | 100.0% |
[ 11.0% - 11.5% ] 11.18% | 121,078 | 94.7% |
[ 11.5% - 12.0% ] 11.61% | 14,557 | 91.9% |
[ 11.5% - 12.0% ] 11.77% | 1,810 | 91.2% |
[ 12.0% - 12.5% ] 12.10% | 20,034 | 95.9% |
[ 12.0% - 12.5% ] 12.28% | 26,021 | 95.0% |
[ 12.5% - 13.0% ] 12.86% | 70 | 100.0% |
[ 13.0% - 13.5% ] 13.17% | 22,540 | 88.4% |
[ 13.5% - 14.0% ] 13.53% | 54,464 | 92.4% |
[ 13.5% - 14.0% ] 13.71% | 1,794 | 95.0% |
[ 14.0% - 14.5% ] 14.19% | 1,057 | 96.1% |
[ 15.0% - 15.5% ] 15.42% | 68,029 | 98.5% |
[ 15.5% - 16.0% ] 15.77% | 11,809 | 99.1% |
[ 16.0% - 16.5% ] 16.28% | 31,514 | 98.4% |
[ 16.0% - 16.5% ] 16.50% | 27,124 | 94.0% |
[ 17.0% - 17.5% ] 17.23% | 383 | 100.0% |
[ 19.5% - 20.0% ] 19.89% | 739 | 97.9% |
[ 21.0% - 21.5% ] 21.29% | 155 | 88.3% |
[ 21.5% - 22.0% ] 21.95% | 41 | 100.0% |
[ 25.0% - 25.5% ] 25.14% | 5,843 | 93.6% |
[ 36.0% - 36.5% ] 36.04% | 1,873 | 88.8% |
[ 36.5% - 37.0% ] 36.95% | 249 | 100.0% |
[ 38.0% - 38.5% ] 38.15% | 249 | 100.0% |
[ 40.5% - 41.0% ] 40.84% | 64,751 | 95.3% |
[ 41.0% - 41.5% ] 41.11% | 74,891 | 95.4% |