Spanish Unemployment Among Women with Children Ages 6 to 17 years

COMPARE

Spanish
Race
Ancestry
AfghanAfricanAlaska NativeAlaskan AthabascanAlbanianAleutAlsatianAmericanApacheArabArapahoArgentineanArmenianAssyrian/Chaldean/SyriacAustralianAustrianBahamianBangladeshiBarbadianBasqueBelgianBelizeanBermudanBhutaneseBlackfeetBolivianBrazilianBritishBritish West IndianBulgarianBurmeseCajunCambodianCanadianCape VerdeanCarpatho RusynCelticCentral AmericanCentral American IndianCherokeeCheyenneChickasawChileanChineseChippewaChoctawColombianColvilleComancheCosta RicanCreeCreekCroatianCrowCubanCypriotCzechCzechoslovakianDanishDelawareDominicanDutchDutch West IndianEastern EuropeanEcuadorianEgyptianEnglishEstonianEthiopianEuropeanFijianFilipinoFinnishFrenchFrench American IndianFrench CanadianGermanGerman RussianGhanaianGreekGuamanian/ChamorroGuatemalanGuyaneseHaitianHmongHonduranHopiHoumaHungarianIcelanderIndian (Asian)IndonesianInupiatIranianIraqiIrishIroquoisIsraeliItalianJamaicanJapaneseJordanianKenyanKiowaKoreanLaotianLatvianLebaneseLiberianLithuanianLumbeeLuxembourgerMacedonianMalaysianMalteseMarshalleseMenomineeMexicanMexican American IndianMongolianMoroccanNative HawaiianNavajoNepaleseNew ZealanderNicaraguanNigerianNorthern EuropeanNorwegianOkinawanOsageOttawaPaiutePakistaniPalestinianPanamanianParaguayanPennsylvania GermanPeruvianPimaPolishPortuguesePotawatomiPuebloPuerto RicanPuget Sound SalishRomanianRussianSalvadoranSamoanScandinavianScotch-IrishScottishSeminoleSenegaleseSerbianShoshoneSierra LeoneanSiouxSlavicSlovakSloveneSomaliSouth AfricanSouth AmericanSouth American IndianSoviet UnionSpaniardSpanishSpanish AmericanSpanish American IndianSri LankanSubsaharan AfricanSudaneseSwedishSwissSyrianTaiwaneseThaiTlingit-HaidaTohono O'OdhamTonganTrinidadian and TobagonianTsimshianTurkishU.S. Virgin IslanderUgandanUkrainianUruguayanUteVenezuelanVietnameseWelshWest IndianYakamaYaquiYugoslavianYumanYup'ikZimbabwean
Immigration
NonimmigrantsImmigrantsAfghanistanAfricaAlbaniaArgentinaArmeniaAsiaAustraliaAustriaBahamasBangladeshBarbadosBelarusBelgiumBelizeBoliviaBosnia and HerzegovinaBrazilBulgariaBurma/MyanmarCabo VerdeCambodiaCameroonCanadaCaribbeanCentral AmericaChileChinaColombiaCongoCosta RicaCroatiaCubaCzechoslovakiaDenmarkDominicaDominican RepublicEastern AfricaEastern AsiaEastern EuropeEcuadorEgyptEl SalvadorEnglandEritreaEthiopiaEuropeFijiFranceGermanyGhanaGreeceGrenadaGuatemalaGuyanaHaitiHondurasHong KongHungaryIndiaIndonesiaIranIraqIrelandIsraelItalyJamaicaJapanJordanKazakhstanKenyaKoreaKuwaitLaosLatin AmericaLatviaLebanonLiberiaLithuaniaMalaysiaMexicoMicronesiaMiddle AfricaMoldovaMoroccoNepalNetherlandsNicaraguaNigeriaNorth AmericaNorth MacedoniaNorthern AfricaNorthern EuropeNorwayOceaniaPakistanPanamaPeruPhilippinesPolandPortugalRomaniaRussiaSaudi ArabiaScotlandSenegalSerbiaSierra LeoneSingaporeSomaliaSouth AfricaSouth AmericaSouth Central AsiaSouth Eastern AsiaSouthern EuropeSpainSri LankaSt. Vincent and the GrenadinesSudanSwedenSwitzerlandSyriaTaiwanThailandTrinidad and TobagoTurkeyUgandaUkraineUruguayUzbekistanVenezuelaVietnamWest IndiesWestern AfricaWestern AsiaWestern EuropeYemenZaireZimbabweAzores
Select to Compare
Race
Ancestry
AfghanAfricanAlaska NativeAlaskan AthabascanAlbanianAleutAlsatianAmericanApacheArabArapahoArgentineanArmenianAssyrian/Chaldean/SyriacAustralianAustrianBahamianBangladeshiBarbadianBasqueBelgianBelizeanBermudanBhutaneseBlackfeetBolivianBrazilianBritishBritish West IndianBulgarianBurmeseCajunCambodianCanadianCape VerdeanCarpatho RusynCelticCentral AmericanCentral American IndianCherokeeCheyenneChickasawChileanChineseChippewaChoctawColombianColvilleComancheCosta RicanCreeCreekCroatianCrowCubanCypriotCzechCzechoslovakianDanishDelawareDominicanDutchDutch West IndianEastern EuropeanEcuadorianEgyptianEnglishEstonianEthiopianEuropeanFijianFilipinoFinnishFrenchFrench American IndianFrench CanadianGermanGerman RussianGhanaianGreekGuamanian/ChamorroGuatemalanGuyaneseHaitianHmongHonduranHopiHoumaHungarianIcelanderIndian (Asian)IndonesianInupiatIranianIraqiIrishIroquoisIsraeliItalianJamaicanJapaneseJordanianKenyanKiowaKoreanLaotianLatvianLebaneseLiberianLithuanianLumbeeLuxembourgerMacedonianMalaysianMalteseMarshalleseMenomineeMexicanMexican American IndianMongolianMoroccanNative HawaiianNavajoNepaleseNew ZealanderNicaraguanNigerianNorthern EuropeanNorwegianOkinawanOsageOttawaPaiutePakistaniPalestinianPanamanianParaguayanPennsylvania GermanPeruvianPimaPolishPortuguesePotawatomiPuebloPuerto RicanPuget Sound SalishRomanianRussianSalvadoranSamoanScandinavianScotch-IrishScottishSeminoleSenegaleseSerbianShoshoneSierra LeoneanSiouxSlavicSlovakSloveneSomaliSouth AfricanSouth AmericanSouth American IndianSoviet UnionSpaniardSpanish AmericanSpanish American IndianSri LankanSubsaharan AfricanSudaneseSwedishSwissSyrianTaiwaneseThaiTlingit-HaidaTohono O'OdhamTonganTrinidadian and TobagonianTsimshianTurkishU.S. Virgin IslanderUgandanUkrainianUruguayanUteVenezuelanVietnameseWelshWest IndianYakamaYaquiYugoslavianYumanYup'ikZimbabwean
Immigration
NonimmigrantsImmigrantsAfghanistanAfricaAlbaniaArgentinaArmeniaAsiaAustraliaAustriaBahamasBangladeshBarbadosBelarusBelgiumBelizeBoliviaBosnia and HerzegovinaBrazilBulgariaBurma/MyanmarCabo VerdeCambodiaCameroonCanadaCaribbeanCentral AmericaChileChinaColombiaCongoCosta RicaCroatiaCubaCzechoslovakiaDenmarkDominicaDominican RepublicEastern AfricaEastern AsiaEastern EuropeEcuadorEgyptEl SalvadorEnglandEritreaEthiopiaEuropeFijiFranceGermanyGhanaGreeceGrenadaGuatemalaGuyanaHaitiHondurasHong KongHungaryIndiaIndonesiaIranIraqIrelandIsraelItalyJamaicaJapanJordanKazakhstanKenyaKoreaKuwaitLaosLatin AmericaLatviaLebanonLiberiaLithuaniaMalaysiaMexicoMicronesiaMiddle AfricaMoldovaMoroccoNepalNetherlandsNicaraguaNigeriaNorth AmericaNorth MacedoniaNorthern AfricaNorthern EuropeNorwayOceaniaPakistanPanamaPeruPhilippinesPolandPortugalRomaniaRussiaSaudi ArabiaScotlandSenegalSerbiaSierra LeoneSingaporeSomaliaSouth AfricaSouth AmericaSouth Central AsiaSouth Eastern AsiaSouthern EuropeSpainSri LankaSt. Vincent and the GrenadinesSudanSwedenSwitzerlandSyriaTaiwanThailandTrinidad and TobagoTurkeyUgandaUkraineUruguayUzbekistanVenezuelaVietnamWest IndiesWestern AfricaWestern AsiaWestern EuropeYemenZaireZimbabweAzores
Unemployment Among Women with Children Ages 6 to 17 years
Income
Poverty
Unemployment
Labor Participation
Family Structure
Vehicle Availability
Education Level
Disability

Spanish Unemployment Among Women with Children Ages 6 to 17 years
Good

8.9%
UNEMPLOYMENT | WOMEN W/ CHILDREN 6 TO 17
63.8/ 100
METRIC RATING
159th/ 347
METRIC RANK

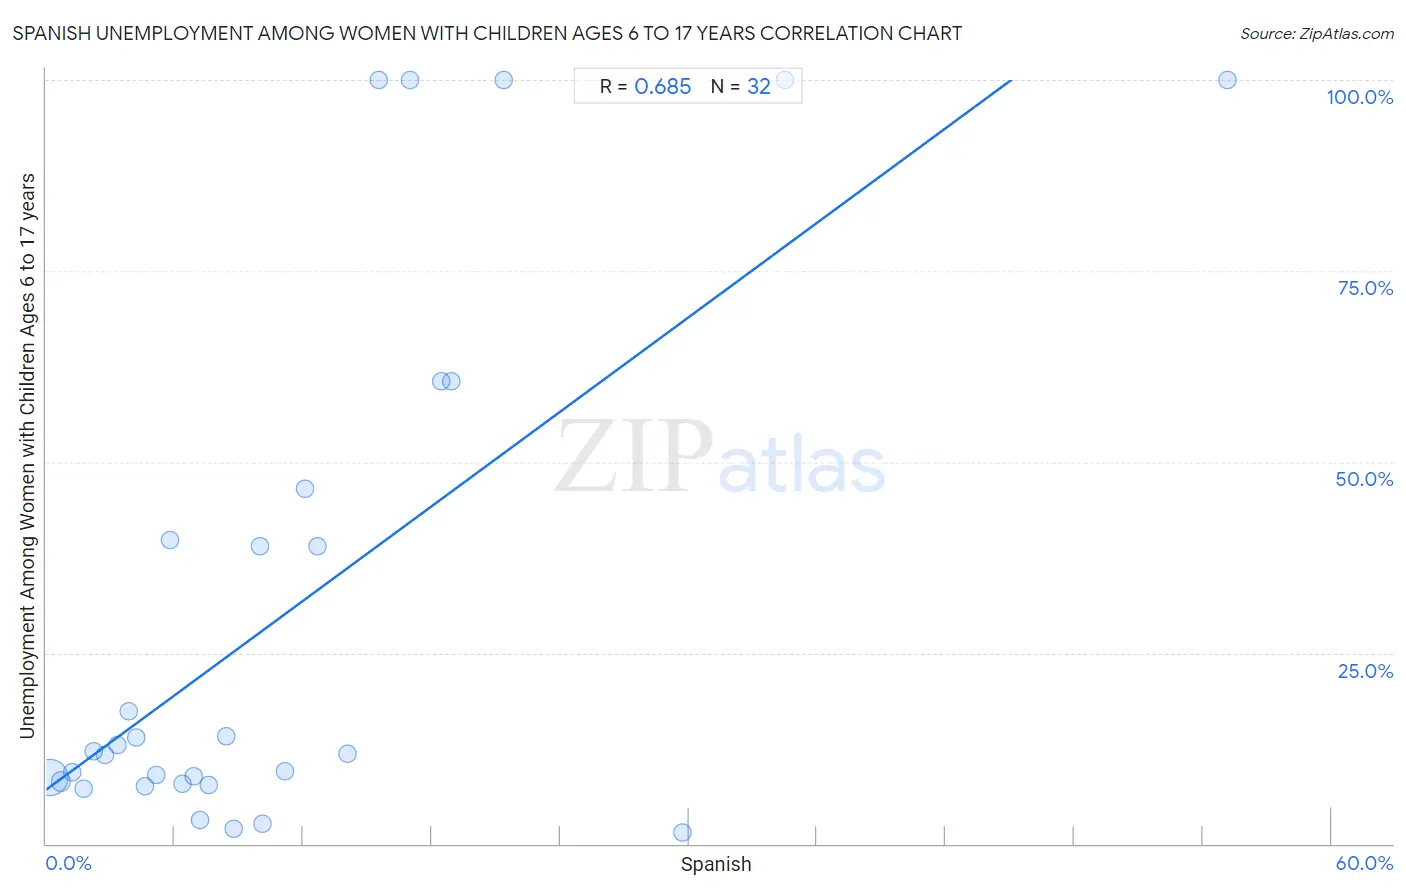
Spanish Unemployment Among Women with Children Ages 6 to 17 years Correlation Chart

The statistical analysis conducted on geographies consisting of 298,620,036 people shows a significant positive correlation between the proportion of Spanish and unemployment rate among women with children between the ages 6 and 17 in the United States with a correlation coefficient (R) of 0.685 and weighted average of 8.9%. On average, for every 1% (one percent) increase in Spanish within a typical geography, there is an increase of 2.1% in unemployment rate among women with children between the ages 6 and 17.
Spanish Unemployment Among Women with Children Ages 6 to 17 years
It is essential to understand that the correlation between the percentage of Spanish and unemployment rate among women with children between the ages 6 and 17 does not imply a direct cause-and-effect relationship. It remains uncertain whether the presence of Spanish influences an upward or downward trend in the level of unemployment rate among women with children between the ages 6 and 17 within an area, or if Spanish simply ended up residing in those areas with higher or lower levels of unemployment rate among women with children between the ages 6 and 17 due to other factors.

Demographics Similar to Spanish by Unemployment Among Women with Children Ages 6 to 17 years

In terms of unemployment among women with children ages 6 to 17 years, the demographic groups most similar to Spanish are Immigrants from Hungary (8.9%, a difference of 0.020%), Immigrants from Guyana (8.9%, a difference of 0.040%), Immigrants from Chile (8.9%, a difference of 0.070%), Immigrants from Belgium (8.9%, a difference of 0.090%), and Osage (8.9%, a difference of 0.10%).
DemographicsRating | RankUnemployment Among Women with Children Ages 6 to 17 years
Immigrants from Northern Europe
74.6
/100
|
#152
Good
8.9%
Immigrants from Europe
73.4
/100
|
#153
Good
8.9%
Vietnamese
72.1
/100
|
#154
Good
8.9%
Immigrants from Greece
71.8
/100
|
#155
Good
8.9%
Osage
65.9
/100
|
#156
Good
8.9%
Immigrants from Belgium
65.6
/100
|
#157
Good
8.9%
Immigrants from Chile
65.3
/100
|
#158
Good
8.9%
Spanish
63.8
/100
|
#159
Good
8.9%
Immigrants from Hungary
63.4
/100
|
#160
Good
8.9%
Immigrants from Guyana
63.0
/100
|
#161
Good
8.9%
Immigrants from Netherlands
60.8
/100
|
#162
Good
8.9%
Mexican American Indians
60.6
/100
|
#163
Good
8.9%
Ukrainians
59.7
/100
|
#164
Average
8.9%
Immigrants from Micronesia
59.2
/100
|
#165
Average
8.9%
Moroccans
58.3
/100
|
#166
Average
8.9%

Spanish Unemployment Among Women with Children Ages 6 to 17 years Correlation Summary

MeasurementSpanish DataUnemployment Among Women with Children Ages 6 to 17 years Data
Minimum0.18%1.4%
Maximum55.2%100.0%
Range55.0%98.6%
Mean11.3%30.4%
Median8.0%11.9%
Interquartile 25% (IQ1)4.0%8.0%
Interquartile 75% (IQ3)14.8%43.2%
Interquartile Range (IQR)10.8%35.2%
Standard Deviation (Sample)11.4%34.4%
Standard Deviation (Population)11.2%33.8%

Correlation Details

Spanish PercentileSample SizeUnemployment Among Women with Children Ages 6 to 17 years
[
0.0%
-
0.5%
]
0.18%
260,084,2748.7%
[
0.5%
-
1.0%
]
0.67%
27,609,0168.1%
[
1.0%
-
1.5%
]
1.22%
6,655,3449.3%
[
1.5%
-
2.0%
]
1.73%
1,458,6307.2%
[
2.0%
-
2.5%
]
2.21%
491,07212.1%
[
2.5%
-
3.0%
]
2.75%
376,63911.6%
[
3.0%
-
3.5%
]
3.31%
142,28712.9%
[
3.5%
-
4.0%
]
3.87%
56,97017.4%
[
4.0%
-
4.5%
]
4.17%
384,97513.8%
[
4.5%
-
5.0%
]
4.62%
763,3737.6%
[
5.0%
-
5.5%
]
5.13%
242,5829.0%
[
5.5%
-
6.0%
]
5.78%
3,63539.8%
[
6.0%
-
6.5%
]
6.36%
65,9187.9%
[
6.5%
-
7.0%
]
6.88%
55,3208.8%
[
7.0%
-
7.5%
]
7.19%
16,0583.1%
[
7.5%
-
8.0%
]
7.56%
89,0157.8%
[
8.0%
-
8.5%
]
8.43%
22,57714.1%
[
8.5%
-
9.0%
]
8.75%
19,8272.0%
[
9.5%
-
10.0%
]
9.99%
1,07138.9%
[
10.0%
-
10.5%
]
10.07%
10,4732.7%
[
11.0%
-
11.5%
]
11.12%
52,2499.5%
[
12.0%
-
12.5%
]
12.08%
5,77946.5%
[
12.5%
-
13.0%
]
12.69%
1,66338.9%
[
14.0%
-
14.5%
]
14.08%
1,25711.8%
[
15.5%
-
16.0%
]
15.52%
1,050100.0%
[
16.5%
-
17.0%
]
16.99%
618100.0%
[
18.0%
-
18.5%
]
18.42%
1,94960.6%
[
18.5%
-
19.0%
]
18.92%
1,89760.6%
[
21.0%
-
21.5%
]
21.38%
491100.0%
[
29.5%
-
30.0%
]
29.72%
2,8061.4%
[
34.0%
-
34.5%
]
34.47%
235100.0%
[
55.0%
-
55.5%
]
55.17%
986100.0%