Spanish Male Disability
COMPARE
Spanish
Select to Compare
Male Disability
Spanish Male Disability
12.7%
DISABILITY | MALES
0.0/ 100
METRIC RATING
284th/ 347
METRIC RANK
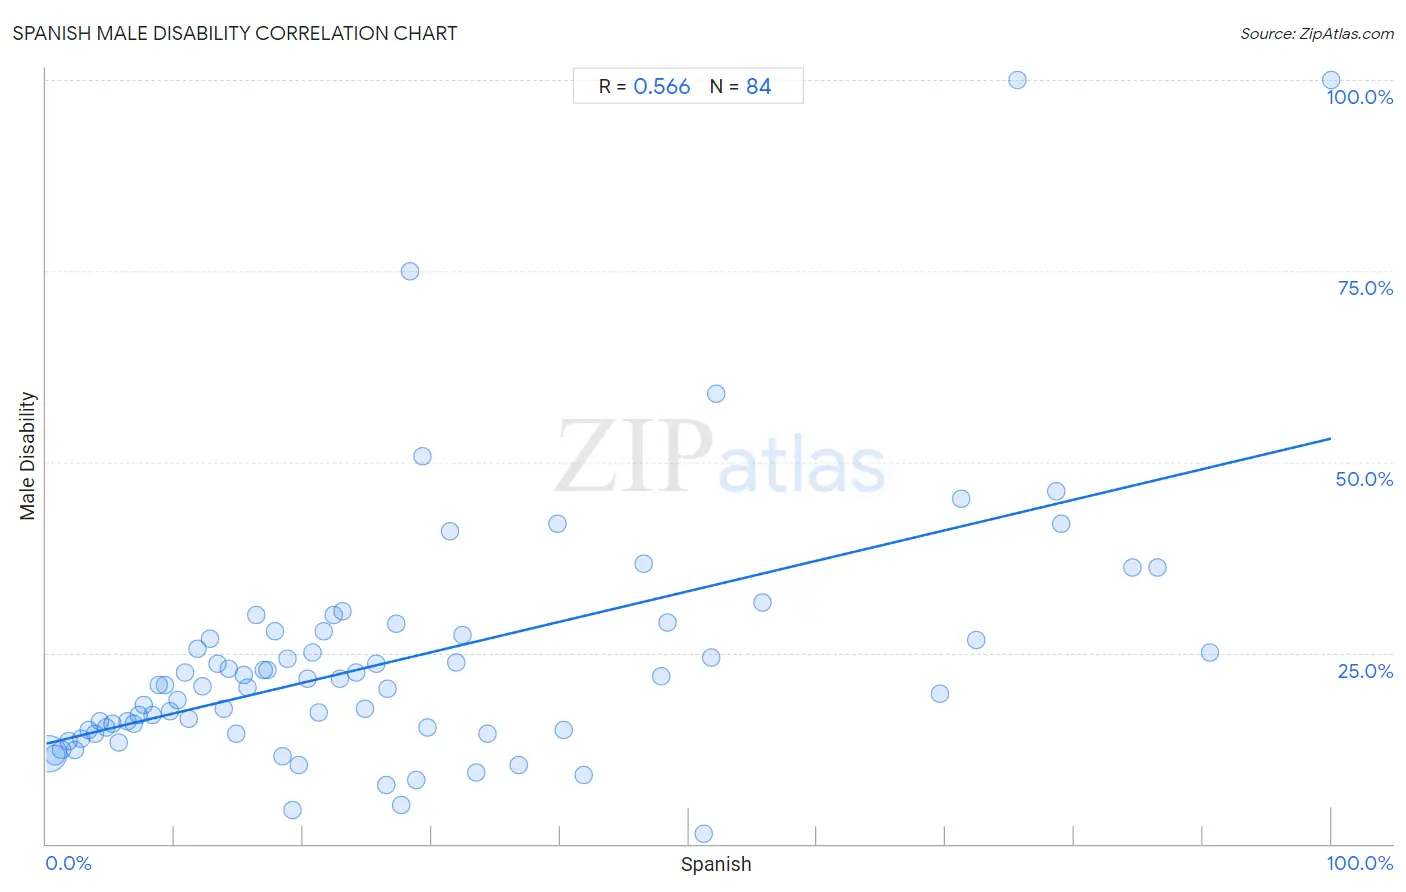
Spanish Male Disability Correlation Chart
The statistical analysis conducted on geographies consisting of 422,078,058 people shows a substantial positive correlation between the proportion of Spanish and percentage of males with a disability in the United States with a correlation coefficient (R) of 0.566 and weighted average of 12.7%. On average, for every 1% (one percent) increase in Spanish within a typical geography, there is an increase of 0.40% in percentage of males with a disability.
It is essential to understand that the correlation between the percentage of Spanish and percentage of males with a disability does not imply a direct cause-and-effect relationship. It remains uncertain whether the presence of Spanish influences an upward or downward trend in the level of percentage of males with a disability within an area, or if Spanish simply ended up residing in those areas with higher or lower levels of percentage of males with a disability due to other factors.
Demographics Similar to Spanish by Male Disability
In terms of male disability, the demographic groups most similar to Spanish are Welsh (12.7%, a difference of 0.0%), Scottish (12.8%, a difference of 0.060%), Cape Verdean (12.8%, a difference of 0.13%), German (12.7%, a difference of 0.27%), and Irish (12.7%, a difference of 0.28%).
| Demographics | Rating | Rank | Male Disability |
| Finns | 0.0 /100 | #277 | Tragic 12.6% |
| Central American Indians | 0.0 /100 | #278 | Tragic 12.7% |
| Slovaks | 0.0 /100 | #279 | Tragic 12.7% |
| Dutch | 0.0 /100 | #280 | Tragic 12.7% |
| Sioux | 0.0 /100 | #281 | Tragic 12.7% |
| Irish | 0.0 /100 | #282 | Tragic 12.7% |
| Germans | 0.0 /100 | #283 | Tragic 12.7% |
| Spanish | 0.0 /100 | #284 | Tragic 12.7% |
| Welsh | 0.0 /100 | #285 | Tragic 12.7% |
| Scottish | 0.0 /100 | #286 | Tragic 12.8% |
| Cape Verdeans | 0.0 /100 | #287 | Tragic 12.8% |
| Yup'ik | 0.0 /100 | #288 | Tragic 12.8% |
| Immigrants from Cabo Verde | 0.0 /100 | #289 | Tragic 12.8% |
| Pima | 0.0 /100 | #290 | Tragic 12.8% |
| Whites/Caucasians | 0.0 /100 | #291 | Tragic 12.8% |
Spanish Male Disability Correlation Summary
| Measurement | Spanish Data | Male Disability Data |
| Minimum | 0.18% | 1.3% |
| Maximum | 100.0% | 100.0% |
| Range | 99.8% | 98.7% |
| Mean | 27.8% | 24.2% |
| Median | 20.9% | 20.8% |
| Interquartile 25% (IQ1) | 10.5% | 14.9% |
| Interquartile 75% (IQ3) | 35.6% | 27.5% |
| Interquartile Range (IQR) | 25.1% | 12.6% |
| Standard Deviation (Sample) | 24.0% | 16.9% |
| Standard Deviation (Population) | 23.8% | 16.8% |
Correlation Details
| Spanish Percentile | Sample Size | Male Disability |
[ 0.0% - 0.5% ] 0.18% | 356,935,759 | 11.8% |
[ 0.5% - 1.0% ] 0.68% | 43,781,102 | 11.6% |
[ 1.0% - 1.5% ] 1.21% | 11,997,570 | 12.3% |
[ 1.5% - 2.0% ] 1.72% | 3,349,375 | 13.4% |
[ 2.0% - 2.5% ] 2.22% | 1,430,916 | 12.2% |
[ 2.5% - 3.0% ] 2.74% | 974,251 | 13.7% |
[ 3.0% - 3.5% ] 3.27% | 407,219 | 14.9% |
[ 3.5% - 4.0% ] 3.77% | 331,062 | 14.3% |
[ 4.0% - 4.5% ] 4.18% | 547,465 | 16.0% |
[ 4.5% - 5.0% ] 4.66% | 917,968 | 15.2% |
[ 5.0% - 5.5% ] 5.18% | 394,830 | 15.7% |
[ 5.5% - 6.0% ] 5.68% | 135,680 | 13.2% |
[ 6.0% - 6.5% ] 6.30% | 118,956 | 16.0% |
[ 6.5% - 7.0% ] 6.80% | 138,716 | 15.7% |
[ 7.0% - 7.5% ] 7.20% | 54,163 | 16.8% |
[ 7.5% - 8.0% ] 7.63% | 137,730 | 18.1% |
[ 8.0% - 8.5% ] 8.24% | 60,022 | 16.8% |
[ 8.5% - 9.0% ] 8.80% | 72,020 | 20.8% |
[ 9.0% - 9.5% ] 9.21% | 36,860 | 20.8% |
[ 9.5% - 10.0% ] 9.64% | 19,894 | 17.4% |
[ 10.0% - 10.5% ] 10.20% | 19,825 | 18.9% |
[ 10.5% - 11.0% ] 10.80% | 15,496 | 22.5% |
[ 11.0% - 11.5% ] 11.13% | 55,234 | 16.3% |
[ 11.5% - 12.0% ] 11.80% | 6,956 | 25.5% |
[ 12.0% - 12.5% ] 12.17% | 9,296 | 20.7% |
[ 12.5% - 13.0% ] 12.77% | 5,810 | 26.9% |
[ 13.0% - 13.5% ] 13.32% | 9,633 | 23.6% |
[ 13.5% - 14.0% ] 13.81% | 2,651 | 17.7% |
[ 14.0% - 14.5% ] 14.20% | 9,393 | 22.8% |
[ 14.5% - 15.0% ] 14.75% | 1,546 | 14.4% |
[ 15.0% - 15.5% ] 15.35% | 14,025 | 22.1% |
[ 15.5% - 16.0% ] 15.62% | 3,412 | 20.4% |
[ 16.0% - 16.5% ] 16.33% | 196 | 30.0% |
[ 16.5% - 17.0% ] 16.88% | 3,898 | 22.7% |
[ 17.0% - 17.5% ] 17.20% | 4,105 | 22.8% |
[ 17.5% - 18.0% ] 17.83% | 886 | 27.8% |
[ 18.0% - 18.5% ] 18.37% | 2,352 | 11.5% |
[ 18.5% - 19.0% ] 18.79% | 6,148 | 24.2% |
[ 19.0% - 19.5% ] 19.12% | 1,527 | 4.4% |
[ 19.5% - 20.0% ] 19.63% | 321 | 10.3% |
[ 20.0% - 20.5% ] 20.35% | 3,046 | 21.5% |
[ 20.5% - 21.0% ] 20.69% | 3,688 | 25.1% |
[ 21.0% - 21.5% ] 21.17% | 6,319 | 17.2% |
[ 21.5% - 22.0% ] 21.61% | 893 | 27.9% |
[ 22.0% - 22.5% ] 22.34% | 6,338 | 29.9% |
[ 22.5% - 23.0% ] 22.88% | 4,078 | 21.6% |
[ 23.0% - 23.5% ] 23.08% | 689 | 30.5% |
[ 24.0% - 24.5% ] 24.12% | 2,359 | 22.4% |
[ 24.5% - 25.0% ] 24.79% | 597 | 17.6% |
[ 25.5% - 26.0% ] 25.66% | 1,391 | 23.6% |
[ 26.0% - 26.5% ] 26.50% | 1,185 | 7.7% |
[ 26.5% - 27.0% ] 26.60% | 861 | 20.4% |
[ 27.0% - 27.5% ] 27.24% | 525 | 28.7% |
[ 27.5% - 28.0% ] 27.61% | 460 | 5.1% |
[ 28.0% - 28.5% ] 28.26% | 92 | 75.0% |
[ 28.5% - 29.0% ] 28.83% | 2,553 | 8.3% |
[ 29.0% - 29.5% ] 29.24% | 383 | 50.8% |
[ 29.5% - 30.0% ] 29.64% | 6,217 | 15.2% |
[ 31.0% - 31.5% ] 31.38% | 682 | 40.8% |
[ 31.5% - 32.0% ] 31.93% | 880 | 23.7% |
[ 32.0% - 32.5% ] 32.38% | 667 | 27.3% |
[ 33.0% - 33.5% ] 33.42% | 1,514 | 9.4% |
[ 34.0% - 34.5% ] 34.32% | 1,833 | 14.4% |
[ 36.5% - 37.0% ] 36.81% | 1,513 | 10.3% |
[ 39.5% - 40.0% ] 39.78% | 274 | 41.8% |
[ 40.0% - 40.5% ] 40.26% | 688 | 14.9% |
[ 41.5% - 42.0% ] 41.86% | 1,137 | 9.0% |
[ 46.0% - 46.5% ] 46.48% | 497 | 36.7% |
[ 47.5% - 48.0% ] 47.82% | 1,583 | 21.9% |
[ 48.0% - 48.5% ] 48.31% | 414 | 29.0% |
[ 51.0% - 51.5% ] 51.15% | 262 | 1.3% |
[ 51.5% - 52.0% ] 51.75% | 1,687 | 24.4% |
[ 52.0% - 52.5% ] 52.14% | 351 | 59.0% |
[ 55.5% - 56.0% ] 55.71% | 429 | 31.7% |
[ 69.5% - 70.0% ] 69.57% | 1,055 | 19.6% |
[ 71.0% - 71.5% ] 71.19% | 2,322 | 45.2% |
[ 72.0% - 72.5% ] 72.33% | 589 | 26.7% |
[ 75.5% - 76.0% ] 75.62% | 242 | 100.0% |
[ 78.5% - 79.0% ] 78.60% | 2,103 | 46.1% |
[ 79.0% - 79.5% ] 79.03% | 62 | 41.9% |
[ 84.0% - 84.5% ] 84.50% | 516 | 36.1% |
[ 86.0% - 86.5% ] 86.46% | 591 | 36.1% |
[ 90.5% - 91.0% ] 90.57% | 159 | 25.0% |
[ 99.5% - 100.0% ] 100.00% | 66 | 100.0% |