Spanish GED/Equivalency
COMPARE
Spanish
Select to Compare
GED/Equivalency
Spanish GED/Equivalency
85.4%
GED/EQUIVALENCY
32.8/ 100
METRIC RATING
185th/ 347
METRIC RANK
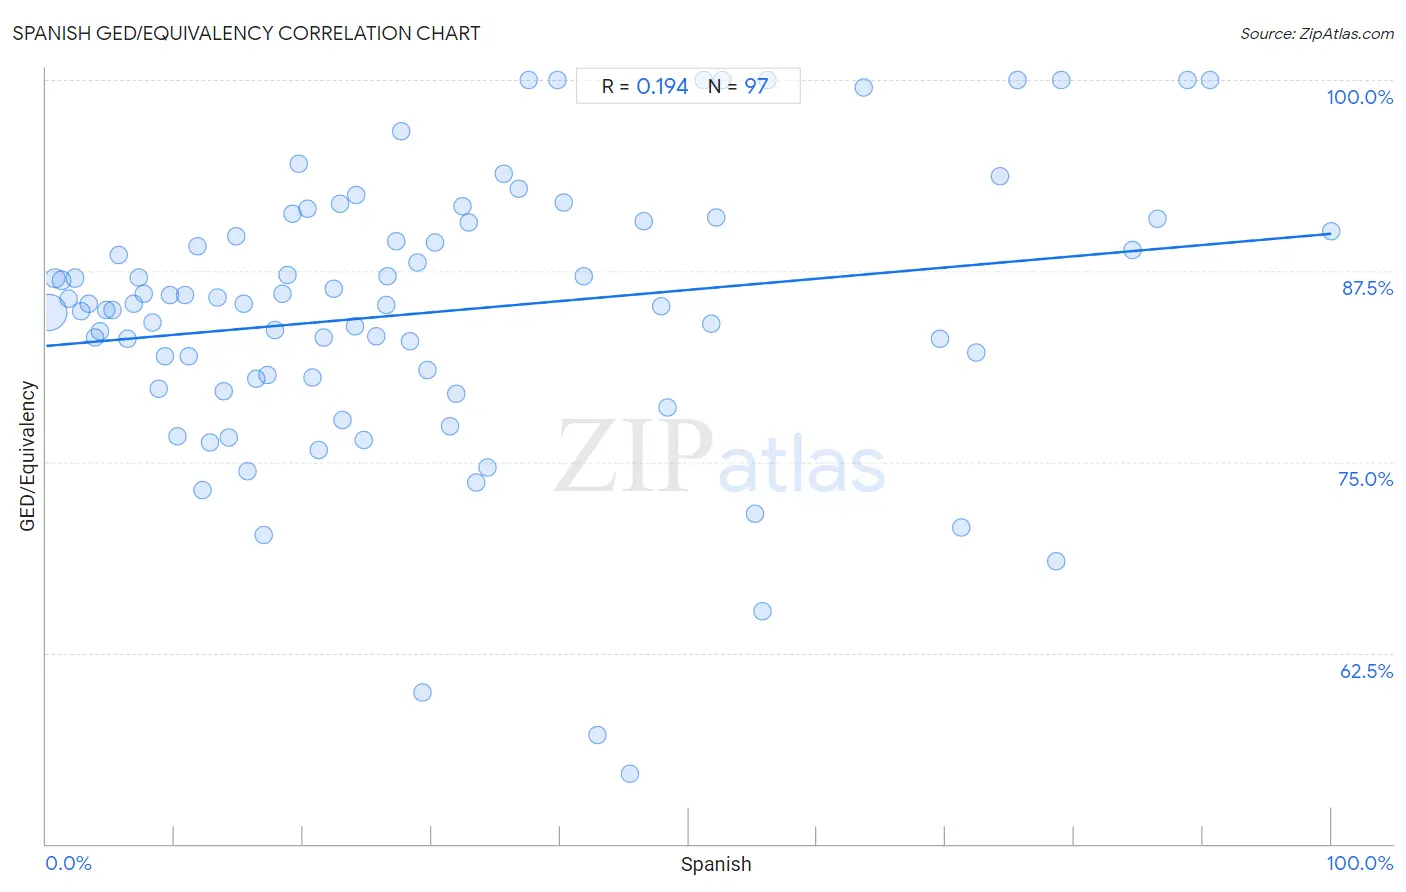
Spanish GED/Equivalency Correlation Chart
The statistical analysis conducted on geographies consisting of 422,188,828 people shows a poor positive correlation between the proportion of Spanish and percentage of population with at least ged/equivalency education in the United States with a correlation coefficient (R) of 0.194 and weighted average of 85.4%. On average, for every 1% (one percent) increase in Spanish within a typical geography, there is an increase of 0.073% in percentage of population with at least ged/equivalency education.
It is essential to understand that the correlation between the percentage of Spanish and percentage of population with at least ged/equivalency education does not imply a direct cause-and-effect relationship. It remains uncertain whether the presence of Spanish influences an upward or downward trend in the level of percentage of population with at least ged/equivalency education within an area, or if Spanish simply ended up residing in those areas with higher or lower levels of percentage of population with at least ged/equivalency education due to other factors.
Demographics Similar to Spanish by GED/Equivalency
In terms of ged/equivalency, the demographic groups most similar to Spanish are Immigrants from Oceania (85.5%, a difference of 0.020%), Spaniard (85.4%, a difference of 0.020%), Immigrants from Sudan (85.5%, a difference of 0.030%), Sudanese (85.5%, a difference of 0.050%), and Immigrants from Afghanistan (85.4%, a difference of 0.070%).
| Demographics | Rating | Rank | GED/Equivalency |
| Koreans | 41.2 /100 | #178 | Average 85.6% |
| Aleuts | 40.5 /100 | #179 | Average 85.6% |
| Immigrants from Southern Europe | 38.4 /100 | #180 | Fair 85.5% |
| Moroccans | 37.7 /100 | #181 | Fair 85.5% |
| Sudanese | 35.2 /100 | #182 | Fair 85.5% |
| Immigrants from Sudan | 34.2 /100 | #183 | Fair 85.5% |
| Immigrants from Oceania | 33.6 /100 | #184 | Fair 85.5% |
| Spanish | 32.8 /100 | #185 | Fair 85.4% |
| Spaniards | 31.9 /100 | #186 | Fair 85.4% |
| Immigrants from Afghanistan | 29.8 /100 | #187 | Fair 85.4% |
| Immigrants from Sierra Leone | 29.0 /100 | #188 | Fair 85.4% |
| Guamanians/Chamorros | 28.4 /100 | #189 | Fair 85.3% |
| Alaskan Athabascans | 27.5 /100 | #190 | Fair 85.3% |
| South American Indians | 22.8 /100 | #191 | Fair 85.2% |
| Nonimmigrants | 22.7 /100 | #192 | Fair 85.2% |
Spanish GED/Equivalency Correlation Summary
| Measurement | Spanish Data | GED/Equivalency Data |
| Minimum | 0.18% | 54.5% |
| Maximum | 100.0% | 100.0% |
| Range | 99.8% | 45.5% |
| Mean | 30.6% | 84.8% |
| Median | 24.1% | 85.4% |
| Interquartile 25% (IQ1) | 12.0% | 80.5% |
| Interquartile 75% (IQ3) | 44.2% | 90.7% |
| Interquartile Range (IQR) | 32.2% | 10.3% |
| Standard Deviation (Sample) | 24.3% | 9.2% |
| Standard Deviation (Population) | 24.2% | 9.1% |
Correlation Details
| Spanish Percentile | Sample Size | GED/Equivalency |
[ 0.0% - 0.5% ] 0.18% | 356,995,937 | 84.8% |
[ 0.5% - 1.0% ] 0.68% | 43,790,128 | 87.0% |
[ 1.0% - 1.5% ] 1.21% | 12,017,261 | 86.9% |
[ 1.5% - 2.0% ] 1.72% | 3,350,588 | 85.7% |
[ 2.0% - 2.5% ] 2.22% | 1,432,494 | 87.0% |
[ 2.5% - 3.0% ] 2.74% | 976,982 | 84.8% |
[ 3.0% - 3.5% ] 3.27% | 409,103 | 85.3% |
[ 3.5% - 4.0% ] 3.77% | 332,099 | 83.2% |
[ 4.0% - 4.5% ] 4.18% | 548,667 | 83.6% |
[ 4.5% - 5.0% ] 4.66% | 918,884 | 85.0% |
[ 5.0% - 5.5% ] 5.18% | 395,402 | 84.9% |
[ 5.5% - 6.0% ] 5.68% | 136,869 | 88.6% |
[ 6.0% - 6.5% ] 6.30% | 120,052 | 83.1% |
[ 6.5% - 7.0% ] 6.80% | 138,862 | 85.4% |
[ 7.0% - 7.5% ] 7.20% | 54,163 | 87.0% |
[ 7.5% - 8.0% ] 7.63% | 138,494 | 86.0% |
[ 8.0% - 8.5% ] 8.24% | 60,022 | 84.1% |
[ 8.5% - 9.0% ] 8.80% | 72,020 | 79.8% |
[ 9.0% - 9.5% ] 9.21% | 37,896 | 81.9% |
[ 9.5% - 10.0% ] 9.64% | 20,119 | 85.9% |
[ 10.0% - 10.5% ] 10.20% | 19,825 | 76.7% |
[ 10.5% - 11.0% ] 10.80% | 15,496 | 85.9% |
[ 11.0% - 11.5% ] 11.13% | 55,729 | 81.9% |
[ 11.5% - 12.0% ] 11.80% | 6,956 | 89.1% |
[ 12.0% - 12.5% ] 12.17% | 9,296 | 73.1% |
[ 12.5% - 13.0% ] 12.77% | 5,810 | 76.3% |
[ 13.0% - 13.5% ] 13.32% | 9,633 | 85.8% |
[ 13.5% - 14.0% ] 13.81% | 2,651 | 79.6% |
[ 14.0% - 14.5% ] 14.20% | 9,393 | 76.6% |
[ 14.5% - 15.0% ] 14.75% | 1,546 | 89.7% |
[ 15.0% - 15.5% ] 15.35% | 14,263 | 85.4% |
[ 15.5% - 16.0% ] 15.62% | 3,412 | 74.4% |
[ 16.0% - 16.5% ] 16.33% | 196 | 80.4% |
[ 16.5% - 17.0% ] 16.88% | 4,005 | 70.2% |
[ 17.0% - 17.5% ] 17.20% | 4,105 | 80.6% |
[ 17.5% - 18.0% ] 17.83% | 886 | 83.7% |
[ 18.0% - 18.5% ] 18.36% | 2,593 | 86.0% |
[ 18.5% - 19.0% ] 18.79% | 6,148 | 87.3% |
[ 19.0% - 19.5% ] 19.12% | 1,527 | 91.2% |
[ 19.5% - 20.0% ] 19.63% | 321 | 94.5% |
[ 20.0% - 20.5% ] 20.36% | 3,095 | 91.6% |
[ 20.5% - 21.0% ] 20.69% | 3,688 | 80.5% |
[ 21.0% - 21.5% ] 21.18% | 6,446 | 75.8% |
[ 21.5% - 22.0% ] 21.63% | 1,008 | 83.2% |
[ 22.0% - 22.5% ] 22.34% | 6,338 | 86.3% |
[ 22.5% - 23.0% ] 22.88% | 4,078 | 91.9% |
[ 23.0% - 23.5% ] 23.08% | 689 | 77.7% |
[ 23.5% - 24.0% ] 23.99% | 746 | 83.9% |
[ 24.0% - 24.5% ] 24.12% | 2,359 | 92.4% |
[ 24.5% - 25.0% ] 24.76% | 1,228 | 76.4% |
[ 25.5% - 26.0% ] 25.66% | 1,391 | 83.2% |
[ 26.0% - 26.5% ] 26.50% | 1,185 | 85.3% |
[ 26.5% - 27.0% ] 26.60% | 861 | 87.2% |
[ 27.0% - 27.5% ] 27.24% | 525 | 89.4% |
[ 27.5% - 28.0% ] 27.61% | 460 | 96.6% |
[ 28.0% - 28.5% ] 28.26% | 92 | 82.9% |
[ 28.5% - 29.0% ] 28.86% | 3,112 | 88.0% |
[ 29.0% - 29.5% ] 29.24% | 383 | 59.9% |
[ 29.5% - 30.0% ] 29.64% | 6,217 | 81.0% |
[ 30.0% - 30.5% ] 30.21% | 96 | 89.3% |
[ 31.0% - 31.5% ] 31.38% | 682 | 77.4% |
[ 31.5% - 32.0% ] 31.93% | 880 | 79.5% |
[ 32.0% - 32.5% ] 32.38% | 667 | 91.7% |
[ 32.5% - 33.0% ] 32.87% | 143 | 90.7% |
[ 33.0% - 33.5% ] 33.42% | 1,532 | 73.7% |
[ 34.0% - 34.5% ] 34.32% | 1,833 | 74.6% |
[ 35.5% - 36.0% ] 35.59% | 59 | 93.9% |
[ 36.5% - 37.0% ] 36.81% | 1,513 | 92.9% |
[ 37.0% - 37.5% ] 37.50% | 8 | 100.0% |
[ 39.5% - 40.0% ] 39.78% | 274 | 100.0% |
[ 40.0% - 40.5% ] 40.26% | 688 | 92.0% |
[ 41.5% - 42.0% ] 41.86% | 1,137 | 87.2% |
[ 42.5% - 43.0% ] 42.86% | 14 | 57.1% |
[ 45.0% - 45.5% ] 45.45% | 22 | 54.5% |
[ 46.0% - 46.5% ] 46.48% | 497 | 90.8% |
[ 47.5% - 48.0% ] 47.82% | 1,583 | 85.2% |
[ 48.0% - 48.5% ] 48.31% | 414 | 78.6% |
[ 51.0% - 51.5% ] 51.15% | 262 | 100.0% |
[ 51.5% - 52.0% ] 51.75% | 1,687 | 84.1% |
[ 52.0% - 52.5% ] 52.14% | 351 | 91.0% |
[ 52.5% - 53.0% ] 52.66% | 357 | 100.0% |
[ 55.0% - 55.5% ] 55.17% | 986 | 71.6% |
[ 55.5% - 56.0% ] 55.71% | 429 | 65.2% |
[ 56.0% - 56.5% ] 56.14% | 57 | 100.0% |
[ 63.5% - 64.0% ] 63.64% | 220 | 99.5% |
[ 69.5% - 70.0% ] 69.57% | 1,055 | 83.1% |
[ 71.0% - 71.5% ] 71.19% | 2,322 | 70.7% |
[ 72.0% - 72.5% ] 72.33% | 589 | 82.1% |
[ 74.0% - 74.5% ] 74.22% | 287 | 93.7% |
[ 75.5% - 76.0% ] 75.62% | 242 | 100.0% |
[ 78.5% - 79.0% ] 78.60% | 2,103 | 68.5% |
[ 79.0% - 79.5% ] 79.03% | 62 | 100.0% |
[ 84.0% - 84.5% ] 84.50% | 516 | 88.9% |
[ 86.0% - 86.5% ] 86.46% | 591 | 91.0% |
[ 88.5% - 89.0% ] 88.78% | 294 | 100.0% |
[ 90.5% - 91.0% ] 90.57% | 159 | 100.0% |
[ 99.5% - 100.0% ] 100.00% | 483 | 90.1% |