Spanish 3 or more Vehicles in Household
COMPARE
Spanish
Select to Compare
3 or more Vehicles in Household
Spanish 3 or more Vehicles in Household
23.1%
3+ VEHICLES AVAILABLE
100.0/ 100
METRIC RATING
29th/ 347
METRIC RANK
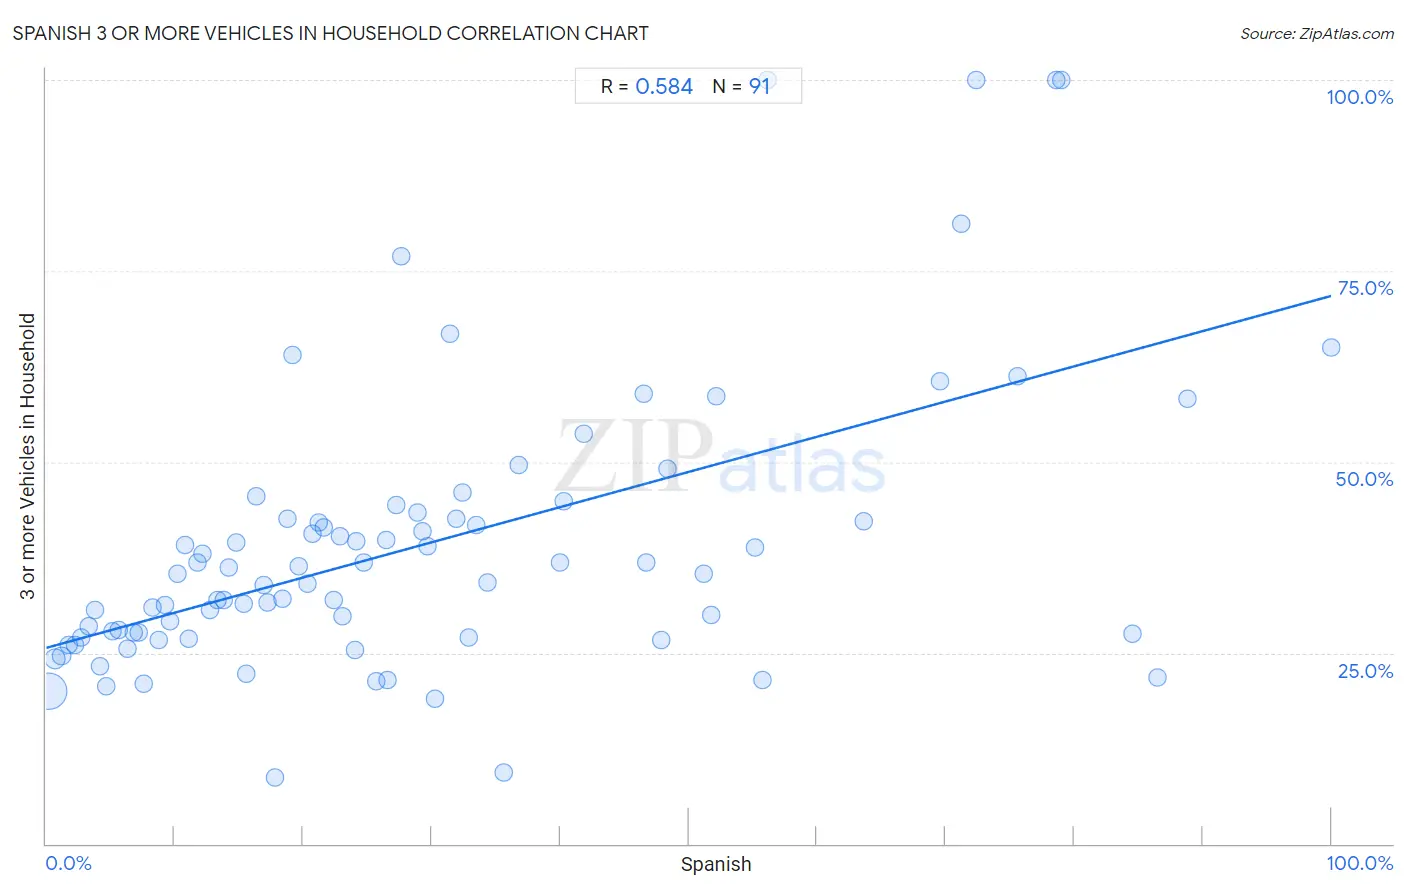
Spanish 3 or more Vehicles in Household Correlation Chart
The statistical analysis conducted on geographies consisting of 421,817,917 people shows a substantial positive correlation between the proportion of Spanish and percentage of households with 3 or more vehicles available in the United States with a correlation coefficient (R) of 0.584 and weighted average of 23.1%. On average, for every 1% (one percent) increase in Spanish within a typical geography, there is an increase of 0.46% in percentage of households with 3 or more vehicles available.
It is essential to understand that the correlation between the percentage of Spanish and percentage of households with 3 or more vehicles available does not imply a direct cause-and-effect relationship. It remains uncertain whether the presence of Spanish influences an upward or downward trend in the level of percentage of households with 3 or more vehicles available within an area, or if Spanish simply ended up residing in those areas with higher or lower levels of percentage of households with 3 or more vehicles available due to other factors.
Demographics Similar to Spanish by 3 or more Vehicles in Household
In terms of 3 or more vehicles in household, the demographic groups most similar to Spanish are Lumbee (23.1%, a difference of 0.070%), Immigrants from South Eastern Asia (23.1%, a difference of 0.17%), English (23.1%, a difference of 0.36%), Guamanian/Chamorro (23.2%, a difference of 0.40%), and Pueblo (23.0%, a difference of 0.45%).
| Demographics | Rating | Rank | 3 or more Vehicles in Household |
| Immigrants from Philippines | 100.0 /100 | #22 | Exceptional 23.8% |
| Scandinavians | 100.0 /100 | #23 | Exceptional 23.6% |
| Sri Lankans | 100.0 /100 | #24 | Exceptional 23.6% |
| Immigrants from Central America | 100.0 /100 | #25 | Exceptional 23.4% |
| Mexican American Indians | 100.0 /100 | #26 | Exceptional 23.3% |
| Guamanians/Chamorros | 100.0 /100 | #27 | Exceptional 23.2% |
| Lumbee | 100.0 /100 | #28 | Exceptional 23.1% |
| Spanish | 100.0 /100 | #29 | Exceptional 23.1% |
| Immigrants from South Eastern Asia | 100.0 /100 | #30 | Exceptional 23.1% |
| English | 100.0 /100 | #31 | Exceptional 23.1% |
| Pueblo | 100.0 /100 | #32 | Exceptional 23.0% |
| Spanish Americans | 100.0 /100 | #33 | Exceptional 23.0% |
| Swiss | 100.0 /100 | #34 | Exceptional 23.0% |
| Choctaw | 100.0 /100 | #35 | Exceptional 23.0% |
| Cherokee | 100.0 /100 | #36 | Exceptional 23.0% |
Spanish 3 or more Vehicles in Household Correlation Summary
| Measurement | Spanish Data | 3 or more Vehicles in Household Data |
| Minimum | 0.18% | 8.7% |
| Maximum | 100.0% | 100.0% |
| Range | 99.8% | 91.3% |
| Mean | 29.1% | 39.1% |
| Median | 22.9% | 35.3% |
| Interquartile 25% (IQ1) | 11.1% | 27.1% |
| Interquartile 75% (IQ3) | 40.3% | 42.6% |
| Interquartile Range (IQR) | 29.1% | 15.5% |
| Standard Deviation (Sample) | 23.7% | 18.7% |
| Standard Deviation (Population) | 23.6% | 18.6% |
Correlation Details
| Spanish Percentile | Sample Size | 3 or more Vehicles in Household |
[ 0.0% - 0.5% ] 0.18% | 356,757,043 | 19.9% |
[ 0.5% - 1.0% ] 0.68% | 43,707,616 | 24.3% |
[ 1.0% - 1.5% ] 1.21% | 11,993,511 | 24.6% |
[ 1.5% - 2.0% ] 1.72% | 3,335,195 | 26.0% |
[ 2.0% - 2.5% ] 2.22% | 1,432,209 | 26.0% |
[ 2.5% - 3.0% ] 2.74% | 975,061 | 27.0% |
[ 3.0% - 3.5% ] 3.27% | 407,219 | 28.5% |
[ 3.5% - 4.0% ] 3.77% | 331,062 | 30.5% |
[ 4.0% - 4.5% ] 4.18% | 548,298 | 23.2% |
[ 4.5% - 5.0% ] 4.66% | 916,960 | 20.6% |
[ 5.0% - 5.5% ] 5.18% | 395,072 | 27.8% |
[ 5.5% - 6.0% ] 5.68% | 136,869 | 28.0% |
[ 6.0% - 6.5% ] 6.30% | 119,537 | 25.5% |
[ 6.5% - 7.0% ] 6.80% | 138,434 | 27.7% |
[ 7.0% - 7.5% ] 7.20% | 54,163 | 27.7% |
[ 7.5% - 8.0% ] 7.63% | 138,135 | 20.9% |
[ 8.0% - 8.5% ] 8.24% | 60,022 | 31.0% |
[ 8.5% - 9.0% ] 8.80% | 72,020 | 26.7% |
[ 9.0% - 9.5% ] 9.21% | 37,896 | 31.2% |
[ 9.5% - 10.0% ] 9.64% | 20,119 | 29.2% |
[ 10.0% - 10.5% ] 10.20% | 19,825 | 35.3% |
[ 10.5% - 11.0% ] 10.80% | 15,496 | 39.1% |
[ 11.0% - 11.5% ] 11.13% | 55,729 | 26.8% |
[ 11.5% - 12.0% ] 11.80% | 6,956 | 36.8% |
[ 12.0% - 12.5% ] 12.17% | 9,296 | 38.1% |
[ 12.5% - 13.0% ] 12.77% | 5,810 | 30.5% |
[ 13.0% - 13.5% ] 13.32% | 9,633 | 32.0% |
[ 13.5% - 14.0% ] 13.81% | 2,651 | 32.0% |
[ 14.0% - 14.5% ] 14.20% | 9,393 | 36.2% |
[ 14.5% - 15.0% ] 14.75% | 1,546 | 39.4% |
[ 15.0% - 15.5% ] 15.35% | 14,185 | 31.4% |
[ 15.5% - 16.0% ] 15.60% | 3,218 | 22.3% |
[ 16.0% - 16.5% ] 16.33% | 196 | 45.5% |
[ 16.5% - 17.0% ] 16.88% | 4,005 | 33.9% |
[ 17.0% - 17.5% ] 17.20% | 4,105 | 31.5% |
[ 17.5% - 18.0% ] 17.83% | 886 | 8.7% |
[ 18.0% - 18.5% ] 18.36% | 2,593 | 32.0% |
[ 18.5% - 19.0% ] 18.79% | 6,148 | 42.5% |
[ 19.0% - 19.5% ] 19.12% | 1,527 | 64.0% |
[ 19.5% - 20.0% ] 19.63% | 321 | 36.3% |
[ 20.0% - 20.5% ] 20.35% | 3,046 | 34.0% |
[ 20.5% - 21.0% ] 20.69% | 3,688 | 40.5% |
[ 21.0% - 21.5% ] 21.17% | 6,319 | 42.1% |
[ 21.5% - 22.0% ] 21.63% | 1,008 | 41.3% |
[ 22.0% - 22.5% ] 22.34% | 6,338 | 31.9% |
[ 22.5% - 23.0% ] 22.88% | 4,078 | 40.3% |
[ 23.0% - 23.5% ] 23.08% | 689 | 29.7% |
[ 23.5% - 24.0% ] 23.99% | 746 | 25.4% |
[ 24.0% - 24.5% ] 24.12% | 2,359 | 39.6% |
[ 24.5% - 25.0% ] 24.76% | 1,228 | 36.9% |
[ 25.5% - 26.0% ] 25.66% | 1,391 | 21.2% |
[ 26.0% - 26.5% ] 26.50% | 1,185 | 39.8% |
[ 26.5% - 27.0% ] 26.60% | 861 | 21.5% |
[ 27.0% - 27.5% ] 27.24% | 525 | 44.4% |
[ 27.5% - 28.0% ] 27.61% | 460 | 76.9% |
[ 28.5% - 29.0% ] 28.86% | 3,112 | 43.4% |
[ 29.0% - 29.5% ] 29.24% | 383 | 40.8% |
[ 29.5% - 30.0% ] 29.64% | 6,217 | 39.0% |
[ 30.0% - 30.5% ] 30.21% | 96 | 19.0% |
[ 31.0% - 31.5% ] 31.38% | 682 | 66.7% |
[ 31.5% - 32.0% ] 31.93% | 880 | 42.6% |
[ 32.0% - 32.5% ] 32.38% | 667 | 45.9% |
[ 32.5% - 33.0% ] 32.87% | 143 | 27.1% |
[ 33.0% - 33.5% ] 33.42% | 1,532 | 41.7% |
[ 34.0% - 34.5% ] 34.32% | 1,833 | 34.2% |
[ 35.5% - 36.0% ] 35.59% | 59 | 9.4% |
[ 36.5% - 37.0% ] 36.81% | 1,513 | 49.5% |
[ 40.0% - 40.5% ] 40.00% | 90 | 36.8% |
[ 40.0% - 40.5% ] 40.26% | 688 | 44.9% |
[ 41.5% - 42.0% ] 41.87% | 1,113 | 53.8% |
[ 46.0% - 46.5% ] 46.48% | 497 | 58.9% |
[ 46.5% - 47.0% ] 46.67% | 360 | 36.9% |
[ 47.5% - 48.0% ] 47.82% | 1,583 | 26.7% |
[ 48.0% - 48.5% ] 48.31% | 414 | 49.2% |
[ 51.0% - 51.5% ] 51.15% | 262 | 35.3% |
[ 51.5% - 52.0% ] 51.75% | 1,687 | 30.0% |
[ 52.0% - 52.5% ] 52.14% | 351 | 58.5% |
[ 55.0% - 55.5% ] 55.17% | 986 | 38.8% |
[ 55.5% - 56.0% ] 55.71% | 429 | 21.4% |
[ 56.0% - 56.5% ] 56.14% | 57 | 100.0% |
[ 63.5% - 64.0% ] 63.64% | 220 | 42.2% |
[ 69.5% - 70.0% ] 69.57% | 1,055 | 60.6% |
[ 71.0% - 71.5% ] 71.19% | 2,322 | 81.1% |
[ 72.0% - 72.5% ] 72.33% | 589 | 100.0% |
[ 75.5% - 76.0% ] 75.62% | 242 | 61.2% |
[ 78.5% - 79.0% ] 78.60% | 2,103 | 100.0% |
[ 79.0% - 79.5% ] 79.03% | 62 | 100.0% |
[ 84.0% - 84.5% ] 84.50% | 516 | 27.4% |
[ 86.0% - 86.5% ] 86.46% | 591 | 21.8% |
[ 88.5% - 89.0% ] 88.78% | 294 | 58.2% |
[ 99.5% - 100.0% ] 100.00% | 408 | 65.0% |