Spanish 4 or more Vehicles in Household
COMPARE
Spanish
Select to Compare
4 or more Vehicles in Household
Spanish 4 or more Vehicles in Household
7.9%
4+ VEHICLES AVAILABLE
100.0/ 100
METRIC RATING
40th/ 347
METRIC RANK
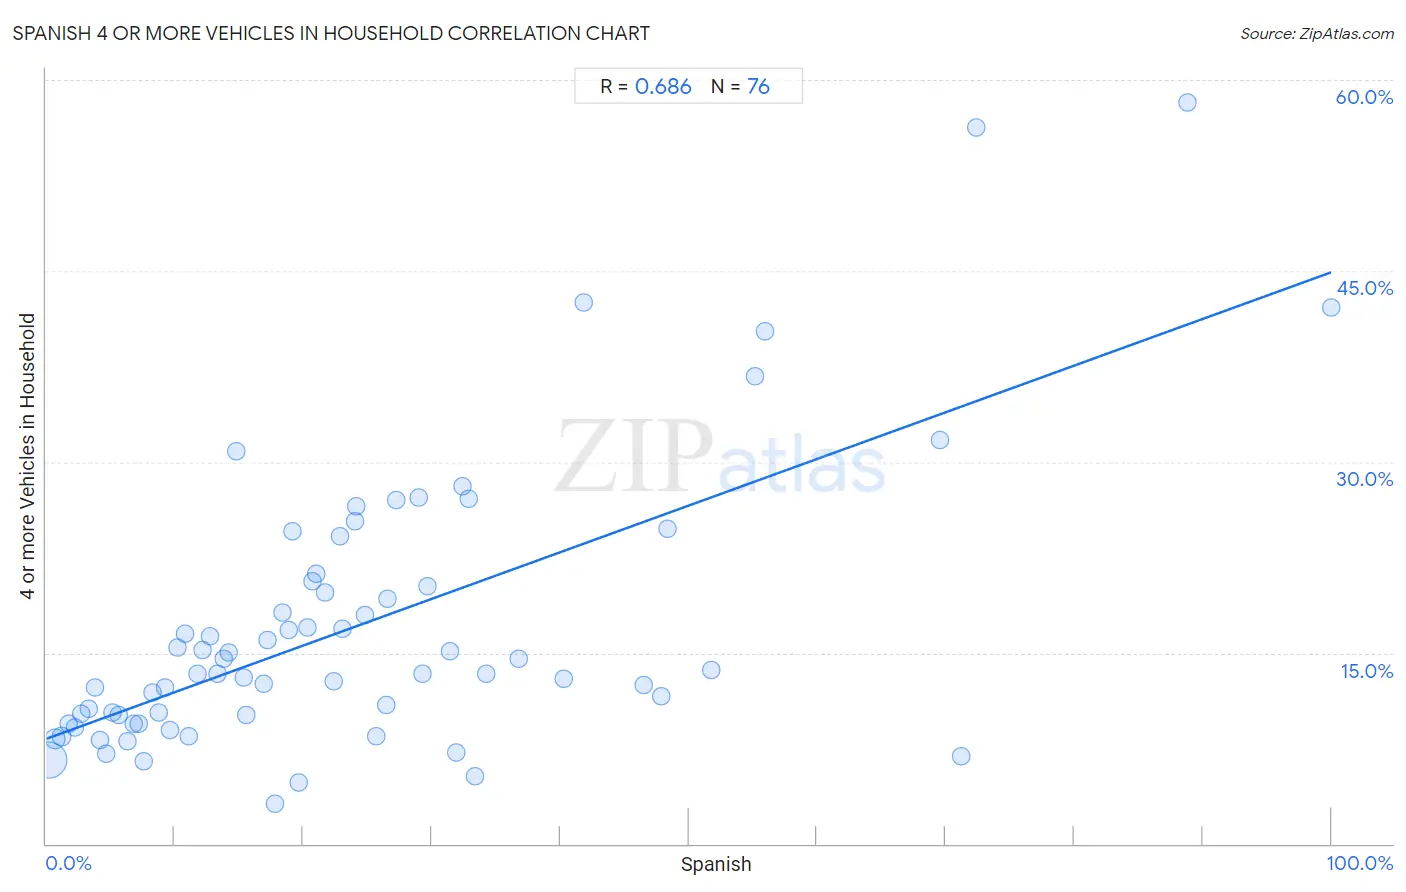
Spanish 4 or more Vehicles in Household Correlation Chart
The statistical analysis conducted on geographies consisting of 420,497,284 people shows a significant positive correlation between the proportion of Spanish and percentage of households with 4 or more vehicles available in the United States with a correlation coefficient (R) of 0.686 and weighted average of 7.9%. On average, for every 1% (one percent) increase in Spanish within a typical geography, there is an increase of 0.37% in percentage of households with 4 or more vehicles available.
It is essential to understand that the correlation between the percentage of Spanish and percentage of households with 4 or more vehicles available does not imply a direct cause-and-effect relationship. It remains uncertain whether the presence of Spanish influences an upward or downward trend in the level of percentage of households with 4 or more vehicles available within an area, or if Spanish simply ended up residing in those areas with higher or lower levels of percentage of households with 4 or more vehicles available due to other factors.
Demographics Similar to Spanish by 4 or more Vehicles in Household
In terms of 4 or more vehicles in household, the demographic groups most similar to Spanish are Pima (7.9%, a difference of 0.57%), Spanish American (8.0%, a difference of 0.63%), Sioux (8.0%, a difference of 0.86%), Scandinavian (8.0%, a difference of 0.89%), and Norwegian (8.0%, a difference of 1.1%).
| Demographics | Rating | Rank | 4 or more Vehicles in Household |
| Yaqui | 100.0 /100 | #33 | Exceptional 8.1% |
| Alaskan Athabascans | 100.0 /100 | #34 | Exceptional 8.1% |
| Guamanians/Chamorros | 100.0 /100 | #35 | Exceptional 8.1% |
| Norwegians | 100.0 /100 | #36 | Exceptional 8.0% |
| Scandinavians | 100.0 /100 | #37 | Exceptional 8.0% |
| Sioux | 100.0 /100 | #38 | Exceptional 8.0% |
| Spanish Americans | 100.0 /100 | #39 | Exceptional 8.0% |
| Spanish | 100.0 /100 | #40 | Exceptional 7.9% |
| Pima | 100.0 /100 | #41 | Exceptional 7.9% |
| Salvadorans | 100.0 /100 | #42 | Exceptional 7.8% |
| Fijians | 100.0 /100 | #43 | Exceptional 7.8% |
| Bhutanese | 100.0 /100 | #44 | Exceptional 7.8% |
| Choctaw | 100.0 /100 | #45 | Exceptional 7.8% |
| Crow | 100.0 /100 | #46 | Exceptional 7.8% |
| Osage | 100.0 /100 | #47 | Exceptional 7.8% |
Spanish 4 or more Vehicles in Household Correlation Summary
| Measurement | Spanish Data | 4 or more Vehicles in Household Data |
| Minimum | 0.18% | 3.2% |
| Maximum | 100.0% | 58.2% |
| Range | 99.8% | 55.0% |
| Mean | 24.0% | 17.0% |
| Median | 19.4% | 13.4% |
| Interquartile 25% (IQ1) | 9.4% | 9.8% |
| Interquartile 75% (IQ3) | 31.7% | 20.4% |
| Interquartile Range (IQR) | 22.2% | 10.7% |
| Standard Deviation (Sample) | 20.5% | 11.0% |
| Standard Deviation (Population) | 20.4% | 10.9% |
Correlation Details
| Spanish Percentile | Sample Size | 4 or more Vehicles in Household |
[ 0.0% - 0.5% ] 0.18% | 355,799,775 | 6.5% |
[ 0.5% - 1.0% ] 0.68% | 43,467,671 | 8.3% |
[ 1.0% - 1.5% ] 1.21% | 11,927,071 | 8.4% |
[ 1.5% - 2.0% ] 1.72% | 3,326,152 | 9.4% |
[ 2.0% - 2.5% ] 2.22% | 1,428,896 | 9.1% |
[ 2.5% - 3.0% ] 2.74% | 970,386 | 10.2% |
[ 3.0% - 3.5% ] 3.27% | 404,138 | 10.6% |
[ 3.5% - 4.0% ] 3.77% | 326,322 | 12.3% |
[ 4.0% - 4.5% ] 4.18% | 546,531 | 8.2% |
[ 4.5% - 5.0% ] 4.66% | 913,691 | 7.1% |
[ 5.0% - 5.5% ] 5.18% | 388,322 | 10.3% |
[ 5.5% - 6.0% ] 5.68% | 135,319 | 10.1% |
[ 6.0% - 6.5% ] 6.30% | 118,656 | 8.0% |
[ 6.5% - 7.0% ] 6.80% | 138,434 | 9.4% |
[ 7.0% - 7.5% ] 7.20% | 53,759 | 9.5% |
[ 7.5% - 8.0% ] 7.63% | 138,135 | 6.5% |
[ 8.0% - 8.5% ] 8.24% | 59,840 | 11.9% |
[ 8.5% - 9.0% ] 8.80% | 71,694 | 10.3% |
[ 9.0% - 9.5% ] 9.21% | 37,896 | 12.2% |
[ 9.5% - 10.0% ] 9.63% | 19,793 | 9.0% |
[ 10.0% - 10.5% ] 10.20% | 19,825 | 15.4% |
[ 10.5% - 11.0% ] 10.80% | 15,049 | 16.5% |
[ 11.0% - 11.5% ] 11.13% | 55,199 | 8.4% |
[ 11.5% - 12.0% ] 11.80% | 6,118 | 13.3% |
[ 12.0% - 12.5% ] 12.14% | 7,861 | 15.2% |
[ 12.5% - 13.0% ] 12.77% | 5,810 | 16.3% |
[ 13.0% - 13.5% ] 13.32% | 9,633 | 13.3% |
[ 13.5% - 14.0% ] 13.81% | 2,651 | 14.5% |
[ 14.0% - 14.5% ] 14.20% | 9,393 | 15.0% |
[ 14.5% - 15.0% ] 14.75% | 1,546 | 30.9% |
[ 15.0% - 15.5% ] 15.35% | 14,039 | 13.1% |
[ 15.5% - 16.0% ] 15.60% | 3,193 | 10.1% |
[ 16.5% - 17.0% ] 16.88% | 3,916 | 12.6% |
[ 17.0% - 17.5% ] 17.20% | 4,105 | 16.0% |
[ 17.5% - 18.0% ] 17.83% | 886 | 3.2% |
[ 18.0% - 18.5% ] 18.37% | 2,352 | 18.1% |
[ 18.5% - 19.0% ] 18.82% | 5,371 | 16.8% |
[ 19.0% - 19.5% ] 19.12% | 1,527 | 24.5% |
[ 19.5% - 20.0% ] 19.63% | 321 | 4.8% |
[ 20.0% - 20.5% ] 20.35% | 3,046 | 17.0% |
[ 20.5% - 21.0% ] 20.69% | 3,688 | 20.6% |
[ 21.0% - 21.5% ] 21.06% | 4,369 | 21.3% |
[ 21.5% - 22.0% ] 21.72% | 442 | 19.8% |
[ 22.0% - 22.5% ] 22.35% | 5,941 | 12.7% |
[ 22.5% - 23.0% ] 22.88% | 4,078 | 24.2% |
[ 23.0% - 23.5% ] 23.08% | 689 | 16.9% |
[ 23.5% - 24.0% ] 23.99% | 746 | 25.4% |
[ 24.0% - 24.5% ] 24.12% | 2,359 | 26.5% |
[ 24.5% - 25.0% ] 24.76% | 1,143 | 17.9% |
[ 25.5% - 26.0% ] 25.66% | 1,391 | 8.5% |
[ 26.0% - 26.5% ] 26.50% | 1,185 | 10.9% |
[ 26.5% - 27.0% ] 26.60% | 861 | 19.2% |
[ 27.0% - 27.5% ] 27.24% | 525 | 27.0% |
[ 28.5% - 29.0% ] 28.99% | 2,063 | 27.2% |
[ 29.0% - 29.5% ] 29.24% | 383 | 13.4% |
[ 29.5% - 30.0% ] 29.64% | 6,217 | 20.3% |
[ 31.0% - 31.5% ] 31.37% | 357 | 15.1% |
[ 31.5% - 32.0% ] 31.93% | 880 | 7.1% |
[ 32.0% - 32.5% ] 32.38% | 667 | 28.0% |
[ 32.5% - 33.0% ] 32.87% | 143 | 27.1% |
[ 33.0% - 33.5% ] 33.33% | 636 | 5.3% |
[ 34.0% - 34.5% ] 34.21% | 1,102 | 13.4% |
[ 36.5% - 37.0% ] 36.81% | 1,513 | 14.5% |
[ 40.0% - 40.5% ] 40.26% | 688 | 13.0% |
[ 41.5% - 42.0% ] 41.87% | 1,113 | 42.5% |
[ 46.0% - 46.5% ] 46.48% | 497 | 12.4% |
[ 47.5% - 48.0% ] 47.82% | 1,583 | 11.6% |
[ 48.0% - 48.5% ] 48.31% | 414 | 24.7% |
[ 51.5% - 52.0% ] 51.75% | 1,687 | 13.7% |
[ 55.0% - 55.5% ] 55.17% | 986 | 36.7% |
[ 55.5% - 56.0% ] 55.96% | 109 | 40.3% |
[ 69.5% - 70.0% ] 69.57% | 1,055 | 31.7% |
[ 71.0% - 71.5% ] 71.19% | 2,322 | 6.9% |
[ 72.0% - 72.5% ] 72.33% | 589 | 56.2% |
[ 88.5% - 89.0% ] 88.78% | 294 | 58.2% |
[ 99.5% - 100.0% ] 100.00% | 247 | 42.2% |