Shoshone College, 1 year or more

COMPARE

Shoshone
Race
Ancestry
AfghanAfricanAlaska NativeAlaskan AthabascanAlbanianAleutAlsatianAmericanApacheArabArapahoArgentineanArmenianAssyrian/Chaldean/SyriacAustralianAustrianBahamianBangladeshiBarbadianBasqueBelgianBelizeanBermudanBhutaneseBlackfeetBolivianBrazilianBritishBritish West IndianBulgarianBurmeseCajunCambodianCanadianCape VerdeanCarpatho RusynCelticCentral AmericanCentral American IndianCherokeeCheyenneChickasawChileanChineseChippewaChoctawColombianColvilleComancheCosta RicanCreeCreekCroatianCrowCubanCypriotCzechCzechoslovakianDanishDelawareDominicanDutchDutch West IndianEastern EuropeanEcuadorianEgyptianEnglishEstonianEthiopianEuropeanFijianFilipinoFinnishFrenchFrench American IndianFrench CanadianGermanGerman RussianGhanaianGreekGuamanian/ChamorroGuatemalanGuyaneseHaitianHmongHonduranHopiHoumaHungarianIcelanderIndian (Asian)IndonesianInupiatIranianIraqiIrishIroquoisIsraeliItalianJamaicanJapaneseJordanianKenyanKiowaKoreanLaotianLatvianLebaneseLiberianLithuanianLumbeeLuxembourgerMacedonianMalaysianMalteseMarshalleseMenomineeMexicanMexican American IndianMongolianMoroccanNative HawaiianNavajoNepaleseNew ZealanderNicaraguanNigerianNorthern EuropeanNorwegianOkinawanOsageOttawaPaiutePakistaniPalestinianPanamanianParaguayanPennsylvania GermanPeruvianPimaPolishPortuguesePotawatomiPuebloPuerto RicanPuget Sound SalishRomanianRussianSalvadoranSamoanScandinavianScotch-IrishScottishSeminoleSenegaleseSerbianShoshoneSierra LeoneanSiouxSlavicSlovakSloveneSomaliSouth AfricanSouth AmericanSouth American IndianSoviet UnionSpaniardSpanishSpanish AmericanSpanish American IndianSri LankanSubsaharan AfricanSudaneseSwedishSwissSyrianTaiwaneseThaiTlingit-HaidaTohono O'OdhamTonganTrinidadian and TobagonianTsimshianTurkishU.S. Virgin IslanderUgandanUkrainianUruguayanUteVenezuelanVietnameseWelshWest IndianYakamaYaquiYugoslavianYumanYup'ikZimbabwean
Immigration
NonimmigrantsImmigrantsAfghanistanAfricaAlbaniaArgentinaArmeniaAsiaAustraliaAustriaBahamasBangladeshBarbadosBelarusBelgiumBelizeBoliviaBosnia and HerzegovinaBrazilBulgariaBurma/MyanmarCabo VerdeCambodiaCameroonCanadaCaribbeanCentral AmericaChileChinaColombiaCongoCosta RicaCroatiaCubaCzechoslovakiaDenmarkDominicaDominican RepublicEastern AfricaEastern AsiaEastern EuropeEcuadorEgyptEl SalvadorEnglandEritreaEthiopiaEuropeFijiFranceGermanyGhanaGreeceGrenadaGuatemalaGuyanaHaitiHondurasHong KongHungaryIndiaIndonesiaIranIraqIrelandIsraelItalyJamaicaJapanJordanKazakhstanKenyaKoreaKuwaitLaosLatin AmericaLatviaLebanonLiberiaLithuaniaMalaysiaMexicoMicronesiaMiddle AfricaMoldovaMoroccoNepalNetherlandsNicaraguaNigeriaNorth AmericaNorth MacedoniaNorthern AfricaNorthern EuropeNorwayOceaniaPakistanPanamaPeruPhilippinesPolandPortugalRomaniaRussiaSaudi ArabiaScotlandSenegalSerbiaSierra LeoneSingaporeSomaliaSouth AfricaSouth AmericaSouth Central AsiaSouth Eastern AsiaSouthern EuropeSpainSri LankaSt. Vincent and the GrenadinesSudanSwedenSwitzerlandSyriaTaiwanThailandTrinidad and TobagoTurkeyUgandaUkraineUruguayUzbekistanVenezuelaVietnamWest IndiesWestern AfricaWestern AsiaWestern EuropeYemenZaireZimbabweAzores
Select to Compare
Race
Ancestry
AfghanAfricanAlaska NativeAlaskan AthabascanAlbanianAleutAlsatianAmericanApacheArabArapahoArgentineanArmenianAssyrian/Chaldean/SyriacAustralianAustrianBahamianBangladeshiBarbadianBasqueBelgianBelizeanBermudanBhutaneseBlackfeetBolivianBrazilianBritishBritish West IndianBulgarianBurmeseCajunCambodianCanadianCape VerdeanCarpatho RusynCelticCentral AmericanCentral American IndianCherokeeCheyenneChickasawChileanChineseChippewaChoctawColombianColvilleComancheCosta RicanCreeCreekCroatianCrowCubanCypriotCzechCzechoslovakianDanishDelawareDominicanDutchDutch West IndianEastern EuropeanEcuadorianEgyptianEnglishEstonianEthiopianEuropeanFijianFilipinoFinnishFrenchFrench American IndianFrench CanadianGermanGerman RussianGhanaianGreekGuamanian/ChamorroGuatemalanGuyaneseHaitianHmongHonduranHopiHoumaHungarianIcelanderIndian (Asian)IndonesianInupiatIranianIraqiIrishIroquoisIsraeliItalianJamaicanJapaneseJordanianKenyanKiowaKoreanLaotianLatvianLebaneseLiberianLithuanianLumbeeLuxembourgerMacedonianMalaysianMalteseMarshalleseMenomineeMexicanMexican American IndianMongolianMoroccanNative HawaiianNavajoNepaleseNew ZealanderNicaraguanNigerianNorthern EuropeanNorwegianOkinawanOsageOttawaPaiutePakistaniPalestinianPanamanianParaguayanPennsylvania GermanPeruvianPimaPolishPortuguesePotawatomiPuebloPuerto RicanPuget Sound SalishRomanianRussianSalvadoranSamoanScandinavianScotch-IrishScottishSeminoleSenegaleseSerbianSierra LeoneanSiouxSlavicSlovakSloveneSomaliSouth AfricanSouth AmericanSouth American IndianSoviet UnionSpaniardSpanishSpanish AmericanSpanish American IndianSri LankanSubsaharan AfricanSudaneseSwedishSwissSyrianTaiwaneseThaiTlingit-HaidaTohono O'OdhamTonganTrinidadian and TobagonianTsimshianTurkishU.S. Virgin IslanderUgandanUkrainianUruguayanUteVenezuelanVietnameseWelshWest IndianYakamaYaquiYugoslavianYumanYup'ikZimbabwean
Immigration
NonimmigrantsImmigrantsAfghanistanAfricaAlbaniaArgentinaArmeniaAsiaAustraliaAustriaBahamasBangladeshBarbadosBelarusBelgiumBelizeBoliviaBosnia and HerzegovinaBrazilBulgariaBurma/MyanmarCabo VerdeCambodiaCameroonCanadaCaribbeanCentral AmericaChileChinaColombiaCongoCosta RicaCroatiaCubaCzechoslovakiaDenmarkDominicaDominican RepublicEastern AfricaEastern AsiaEastern EuropeEcuadorEgyptEl SalvadorEnglandEritreaEthiopiaEuropeFijiFranceGermanyGhanaGreeceGrenadaGuatemalaGuyanaHaitiHondurasHong KongHungaryIndiaIndonesiaIranIraqIrelandIsraelItalyJamaicaJapanJordanKazakhstanKenyaKoreaKuwaitLaosLatin AmericaLatviaLebanonLiberiaLithuaniaMalaysiaMexicoMicronesiaMiddle AfricaMoldovaMoroccoNepalNetherlandsNicaraguaNigeriaNorth AmericaNorth MacedoniaNorthern AfricaNorthern EuropeNorwayOceaniaPakistanPanamaPeruPhilippinesPolandPortugalRomaniaRussiaSaudi ArabiaScotlandSenegalSerbiaSierra LeoneSingaporeSomaliaSouth AfricaSouth AmericaSouth Central AsiaSouth Eastern AsiaSouthern EuropeSpainSri LankaSt. Vincent and the GrenadinesSudanSwedenSwitzerlandSyriaTaiwanThailandTrinidad and TobagoTurkeyUgandaUkraineUruguayUzbekistanVenezuelaVietnamWest IndiesWestern AfricaWestern AsiaWestern EuropeYemenZaireZimbabweAzores
College, 1 year or more
Income
Poverty
Unemployment
Labor Participation
Family Structure
Vehicle Availability
Education Level
Disability

Shoshone College, 1 year or more
Tragic

54.3%
COLLEGE, 1 YEAR OR MORE
0.2/ 100
METRIC RATING
276th/ 347
METRIC RANK

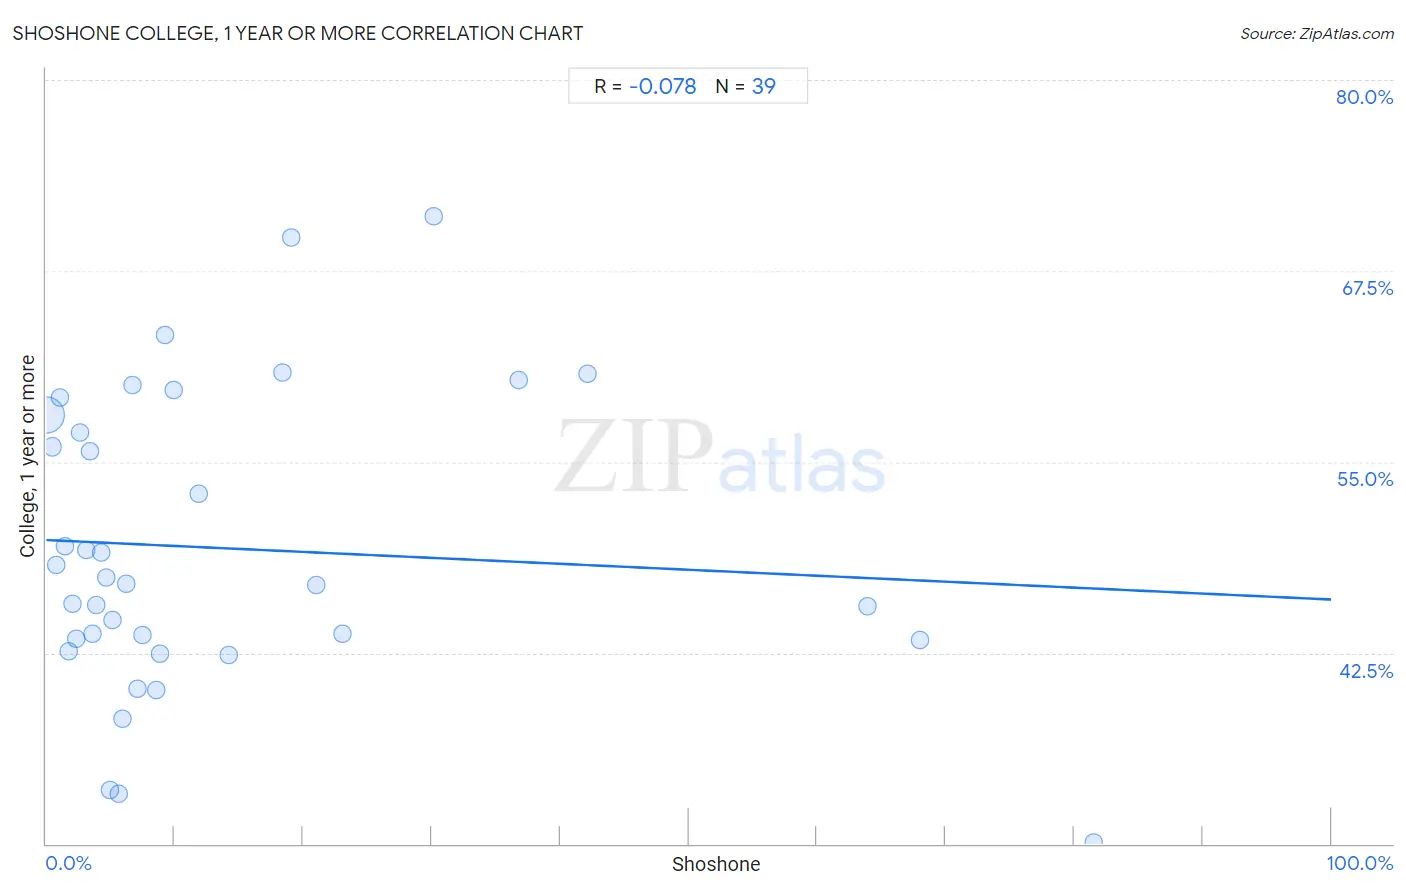
Shoshone College, 1 year or more Correlation Chart

The statistical analysis conducted on geographies consisting of 66,627,303 people shows a slight negative correlation between the proportion of Shoshone and percentage of population with at least college, 1 year or more education in the United States with a correlation coefficient (R) of -0.078 and weighted average of 54.3%. On average, for every 1% (one percent) increase in Shoshone within a typical geography, there is a decrease of 0.039% in percentage of population with at least college, 1 year or more education.
Shoshone College, 1 year or more
It is essential to understand that the correlation between the percentage of Shoshone and percentage of population with at least college, 1 year or more education does not imply a direct cause-and-effect relationship. It remains uncertain whether the presence of Shoshone influences an upward or downward trend in the level of percentage of population with at least college, 1 year or more education within an area, or if Shoshone simply ended up residing in those areas with higher or lower levels of percentage of population with at least college, 1 year or more education due to other factors.

Demographics Similar to Shoshone by College, 1 year or more

In terms of college, 1 year or more, the demographic groups most similar to Shoshone are Ecuadorian (54.3%, a difference of 0.040%), American (54.4%, a difference of 0.080%), Belizean (54.4%, a difference of 0.11%), Immigrants from Grenada (54.4%, a difference of 0.15%), and Comanche (54.4%, a difference of 0.18%).
DemographicsRating | RankCollege, 1 year or more
Bangladeshis
0.2
/100
|
#269
Tragic
54.5%
Crow
0.2
/100
|
#270
Tragic
54.5%
Bahamians
0.2
/100
|
#271
Tragic
54.5%
Comanche
0.2
/100
|
#272
Tragic
54.4%
Immigrants from Grenada
0.2
/100
|
#273
Tragic
54.4%
Belizeans
0.2
/100
|
#274
Tragic
54.4%
Americans
0.2
/100
|
#275
Tragic
54.4%
Shoshone
0.2
/100
|
#276
Tragic
54.3%
Ecuadorians
0.2
/100
|
#277
Tragic
54.3%
Immigrants from Jamaica
0.1
/100
|
#278
Tragic
54.2%
Arapaho
0.1
/100
|
#279
Tragic
54.1%
Cheyenne
0.1
/100
|
#280
Tragic
54.1%
Colville
0.1
/100
|
#281
Tragic
54.1%
Guyanese
0.1
/100
|
#282
Tragic
54.1%
Nicaraguans
0.1
/100
|
#283
Tragic
53.9%

Shoshone College, 1 year or more Correlation Summary

MeasurementShoshone DataCollege, 1 year or more Data
Minimum0.025%30.1%
Maximum81.5%71.1%
Range81.5%41.0%
Mean14.1%49.3%
Median6.2%47.0%
Interquartile 25% (IQ1)3.1%43.3%
Interquartile 75% (IQ3)18.4%58.0%
Interquartile Range (IQR)15.3%14.7%
Standard Deviation (Sample)19.4%9.7%
Standard Deviation (Population)19.2%9.6%

Correlation Details

Shoshone PercentileSample SizeCollege, 1 year or more
[
0.0%
-
0.5%
]
0.025%
65,369,57058.0%
[
0.0%
-
0.5%
]
0.47%
679,91156.0%
[
0.5%
-
1.0%
]
0.76%
287,08448.3%
[
1.0%
-
1.5%
]
1.07%
67,81559.3%
[
1.0%
-
1.5%
]
1.45%
80,75449.5%
[
1.5%
-
2.0%
]
1.71%
9,50842.6%
[
2.0%
-
2.5%
]
2.07%
3,32945.7%
[
2.0%
-
2.5%
]
2.37%
33,84843.4%
[
2.5%
-
3.0%
]
2.64%
2,23656.9%
[
3.0%
-
3.5%
]
3.08%
13,22549.2%
[
3.0%
-
3.5%
]
3.39%
29,20455.7%
[
3.5%
-
4.0%
]
3.61%
1,10743.8%
[
3.5%
-
4.0%
]
3.91%
1,04945.6%
[
4.0%
-
4.5%
]
4.30%
3,25849.0%
[
4.5%
-
5.0%
]
4.70%
3,95747.5%
[
5.0%
-
5.5%
]
5.00%
52033.5%
[
5.0%
-
5.5%
]
5.16%
3,49044.7%
[
5.5%
-
6.0%
]
5.63%
1,35033.3%
[
5.5%
-
6.0%
]
5.96%
7,21238.2%
[
6.0%
-
6.5%
]
6.21%
29047.0%
[
6.5%
-
7.0%
]
6.68%
13,98960.1%
[
7.0%
-
7.5%
]
7.14%
1,82140.2%
[
7.0%
-
7.5%
]
7.50%
24043.6%
[
8.5%
-
9.0%
]
8.51%
2,60840.1%
[
8.5%
-
9.0%
]
8.83%
2,26542.4%
[
9.0%
-
9.5%
]
9.23%
13063.3%
[
9.5%
-
10.0%
]
9.94%
18159.7%
[
11.5%
-
12.0%
]
11.83%
1,74152.9%
[
14.0%
-
14.5%
]
14.21%
60542.4%
[
18.0%
-
18.5%
]
18.37%
28360.8%
[
19.0%
-
19.5%
]
19.05%
23169.7%
[
21.0%
-
21.5%
]
21.05%
30446.9%
[
23.0%
-
23.5%
]
23.08%
7843.7%
[
30.0%
-
30.5%
]
30.15%
19971.1%
[
36.5%
-
37.0%
]
36.78%
17460.3%
[
42.0%
-
42.5%
]
42.11%
51360.8%
[
63.5%
-
64.0%
]
63.88%
1,48145.5%
[
68.0%
-
68.5%
]
68.00%
1,59743.3%
[
81.5%
-
82.0%
]
81.51%
14630.1%