Shoshone Receiving Food Stamps
COMPARE
Shoshone
Select to Compare
Receiving Food Stamps
Shoshone Receiving Food Stamps
12.4%
PUBLIC INCOME | FOOD STAMPS
17.7/ 100
METRIC RATING
203rd/ 347
METRIC RANK
Shoshone Receiving Food Stamps Correlation Chart
The statistical analysis conducted on geographies consisting of 66,597,434 people shows a substantial positive correlation between the proportion of Shoshone and percentage of population receiving government assistance and/or food stamps in the United States with a correlation coefficient (R) of 0.557 and weighted average of 12.4%. On average, for every 1% (one percent) increase in Shoshone within a typical geography, there is an increase of 0.13% in percentage of population receiving government assistance and/or food stamps.
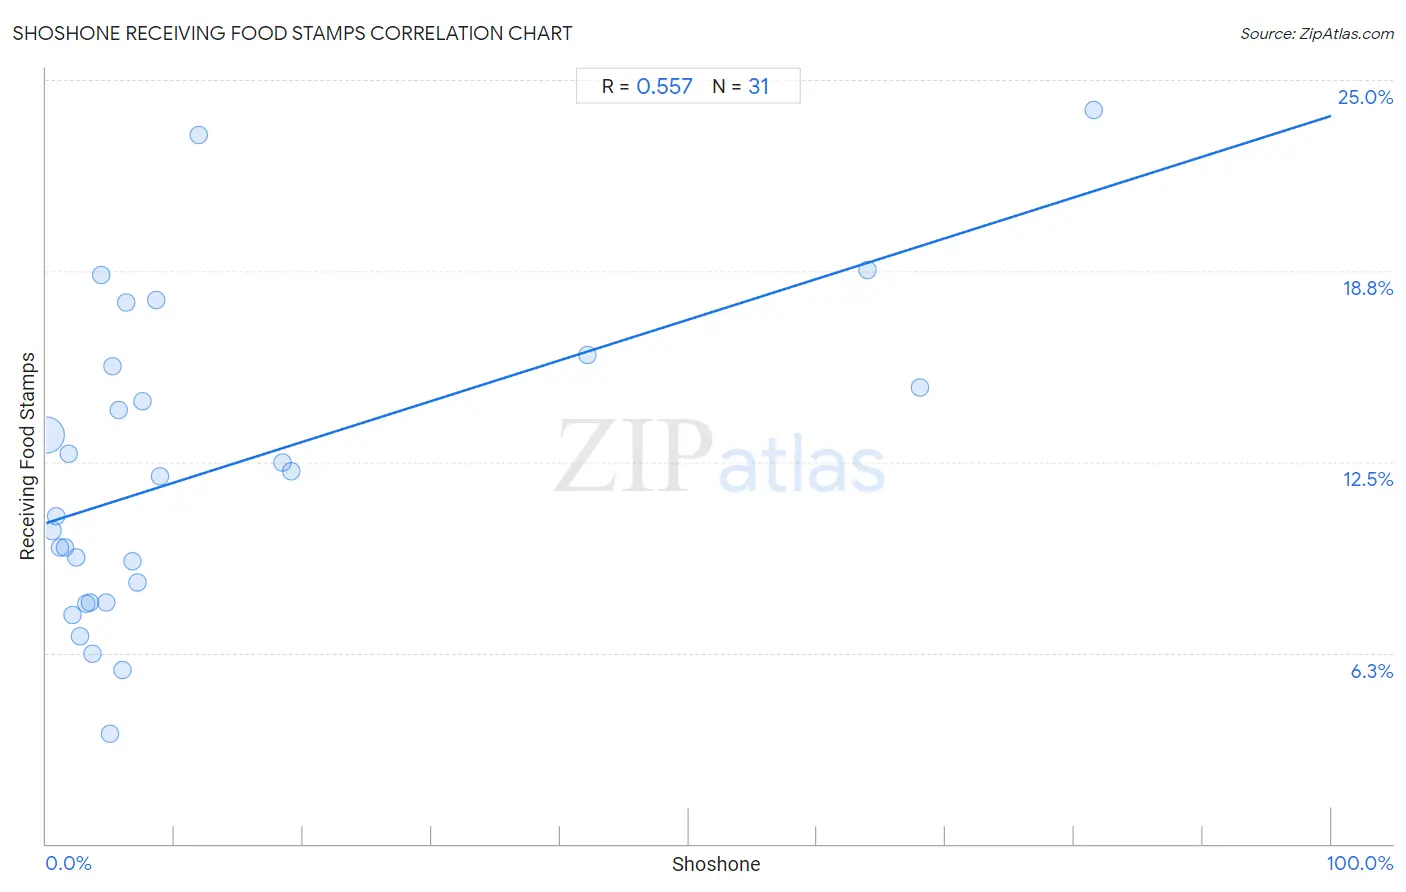
It is essential to understand that the correlation between the percentage of Shoshone and percentage of population receiving government assistance and/or food stamps does not imply a direct cause-and-effect relationship. It remains uncertain whether the presence of Shoshone influences an upward or downward trend in the level of percentage of population receiving government assistance and/or food stamps within an area, or if Shoshone simply ended up residing in those areas with higher or lower levels of percentage of population receiving government assistance and/or food stamps due to other factors.
Demographics Similar to Shoshone by Receiving Food Stamps
In terms of receiving food stamps, the demographic groups most similar to Shoshone are Nonimmigrants (12.4%, a difference of 0.030%), Aleut (12.4%, a difference of 0.090%), Immigrants from Thailand (12.4%, a difference of 0.16%), South American (12.4%, a difference of 0.42%), and Immigrants from Venezuela (12.3%, a difference of 0.53%).
| Demographics | Rating | Rank | Receiving Food Stamps |
| Iraqis | 26.6 /100 | #196 | Fair 12.2% |
| Delaware | 26.1 /100 | #197 | Fair 12.2% |
| Immigrants from Costa Rica | 25.4 /100 | #198 | Fair 12.2% |
| Portuguese | 25.1 /100 | #199 | Fair 12.2% |
| Sierra Leoneans | 23.6 /100 | #200 | Fair 12.2% |
| Ugandans | 22.5 /100 | #201 | Fair 12.2% |
| Immigrants from Venezuela | 20.1 /100 | #202 | Fair 12.3% |
| Shoshone | 17.7 /100 | #203 | Poor 12.4% |
| Nonimmigrants | 17.6 /100 | #204 | Poor 12.4% |
| Aleuts | 17.3 /100 | #205 | Poor 12.4% |
| Immigrants from Thailand | 17.0 /100 | #206 | Poor 12.4% |
| South Americans | 16.0 /100 | #207 | Poor 12.4% |
| Potawatomi | 14.6 /100 | #208 | Poor 12.5% |
| Immigrants from Sierra Leone | 12.9 /100 | #209 | Poor 12.5% |
| Immigrants from Uruguay | 12.8 /100 | #210 | Poor 12.5% |
Shoshone Receiving Food Stamps Correlation Summary
| Measurement | Shoshone Data | Receiving Food Stamps Data |
| Minimum | 0.025% | 3.6% |
| Maximum | 81.5% | 24.0% |
| Range | 81.5% | 20.4% |
| Mean | 13.0% | 12.2% |
| Median | 5.2% | 12.0% |
| Interquartile 25% (IQ1) | 2.4% | 7.9% |
| Interquartile 75% (IQ3) | 8.8% | 15.6% |
| Interquartile Range (IQR) | 6.5% | 7.7% |
| Standard Deviation (Sample) | 21.0% | 5.0% |
| Standard Deviation (Population) | 20.7% | 4.9% |
Correlation Details
| Shoshone Percentile | Sample Size | Receiving Food Stamps |
[ 0.0% - 0.5% ] 0.025% | 65,358,528 | 13.4% |
[ 0.0% - 0.5% ] 0.47% | 667,725 | 10.3% |
[ 0.5% - 1.0% ] 0.76% | 286,454 | 10.7% |
[ 1.0% - 1.5% ] 1.07% | 66,379 | 9.7% |
[ 1.0% - 1.5% ] 1.45% | 80,243 | 9.7% |
[ 1.5% - 2.0% ] 1.71% | 9,508 | 12.8% |
[ 2.0% - 2.5% ] 2.07% | 3,329 | 7.5% |
[ 2.0% - 2.5% ] 2.37% | 33,848 | 9.4% |
[ 2.5% - 3.0% ] 2.64% | 2,236 | 6.8% |
[ 3.0% - 3.5% ] 3.07% | 12,151 | 7.9% |
[ 3.0% - 3.5% ] 3.39% | 29,204 | 7.9% |
[ 3.5% - 4.0% ] 3.61% | 1,107 | 6.2% |
[ 4.0% - 4.5% ] 4.30% | 3,258 | 18.6% |
[ 4.5% - 5.0% ] 4.70% | 3,957 | 7.9% |
[ 5.0% - 5.5% ] 5.00% | 520 | 3.6% |
[ 5.0% - 5.5% ] 5.16% | 3,490 | 15.6% |
[ 5.5% - 6.0% ] 5.63% | 1,350 | 14.2% |
[ 5.5% - 6.0% ] 5.96% | 7,212 | 5.7% |
[ 6.0% - 6.5% ] 6.21% | 290 | 17.7% |
[ 6.5% - 7.0% ] 6.68% | 13,989 | 9.3% |
[ 7.0% - 7.5% ] 7.14% | 1,821 | 8.5% |
[ 7.0% - 7.5% ] 7.50% | 240 | 14.5% |
[ 8.5% - 9.0% ] 8.51% | 2,608 | 17.8% |
[ 8.5% - 9.0% ] 8.83% | 2,265 | 12.0% |
[ 11.5% - 12.0% ] 11.83% | 1,471 | 23.2% |
[ 18.0% - 18.5% ] 18.37% | 283 | 12.5% |
[ 19.0% - 19.5% ] 19.05% | 231 | 12.2% |
[ 42.0% - 42.5% ] 42.11% | 513 | 16.0% |
[ 63.5% - 64.0% ] 63.88% | 1,481 | 18.8% |
[ 68.0% - 68.5% ] 68.00% | 1,597 | 14.9% |
[ 81.5% - 82.0% ] 81.51% | 146 | 24.0% |