Shoshone Male Disability
COMPARE
Shoshone
Select to Compare
Male Disability
Shoshone Male Disability
13.8%
DISABILITY | MALES
0.0/ 100
METRIC RATING
321st/ 347
METRIC RANK
Shoshone Male Disability Correlation Chart
The statistical analysis conducted on geographies consisting of 66,619,814 people shows a poor positive correlation between the proportion of Shoshone and percentage of males with a disability in the United States with a correlation coefficient (R) of 0.141 and weighted average of 13.8%. On average, for every 1% (one percent) increase in Shoshone within a typical geography, there is an increase of 0.046% in percentage of males with a disability.
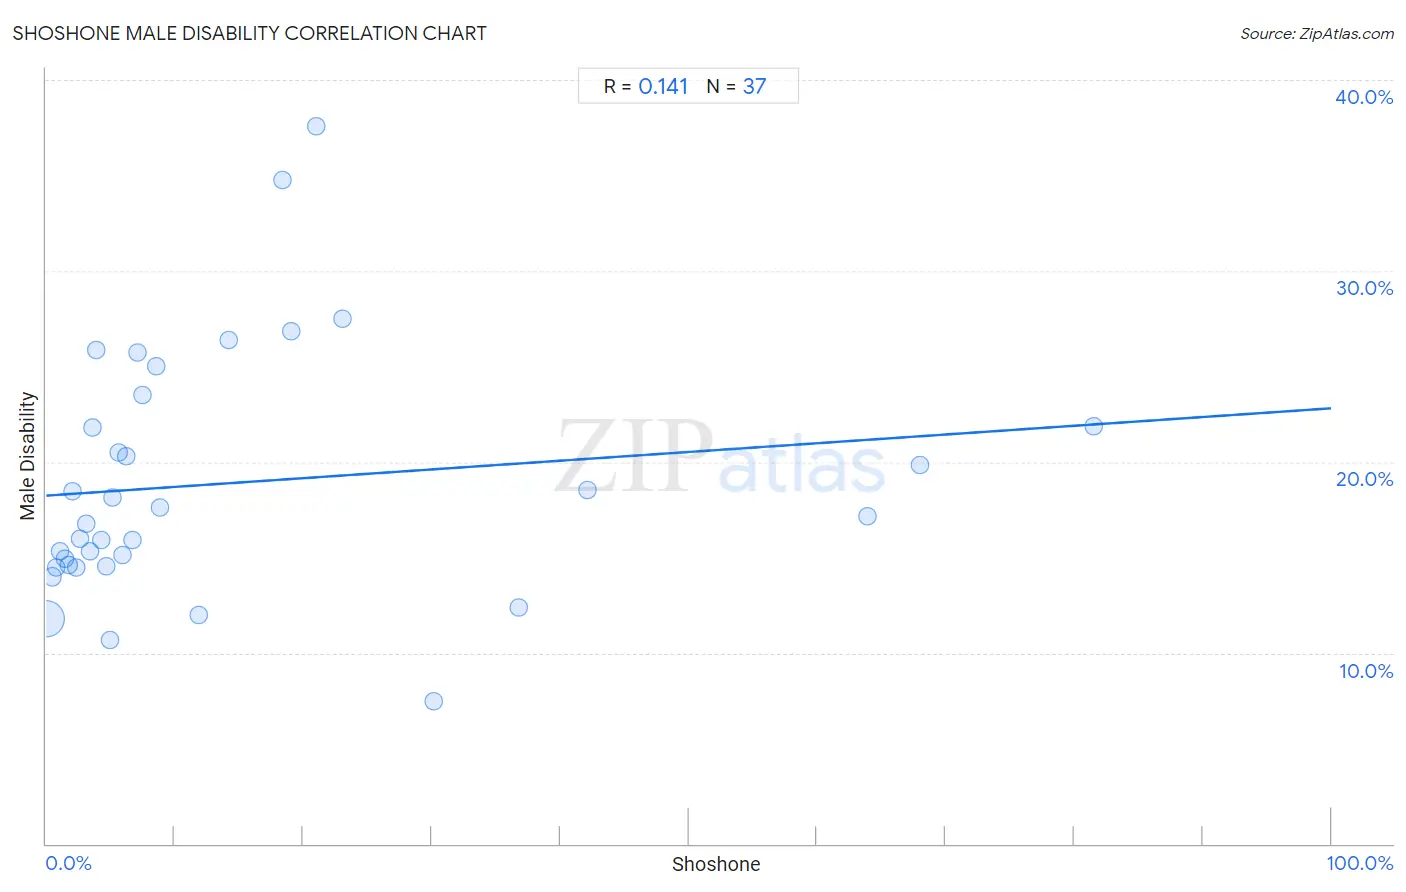
It is essential to understand that the correlation between the percentage of Shoshone and percentage of males with a disability does not imply a direct cause-and-effect relationship. It remains uncertain whether the presence of Shoshone influences an upward or downward trend in the level of percentage of males with a disability within an area, or if Shoshone simply ended up residing in those areas with higher or lower levels of percentage of males with a disability due to other factors.
Demographics Similar to Shoshone by Male Disability
In terms of male disability, the demographic groups most similar to Shoshone are Tlingit-Haida (13.8%, a difference of 0.050%), American (13.8%, a difference of 0.54%), Cree (13.7%, a difference of 0.96%), Apache (14.0%, a difference of 1.1%), and Paiute (13.7%, a difference of 1.2%).
| Demographics | Rating | Rank | Male Disability |
| Aleuts | 0.0 /100 | #314 | Tragic 13.5% |
| Iroquois | 0.0 /100 | #315 | Tragic 13.6% |
| Alaska Natives | 0.0 /100 | #316 | Tragic 13.6% |
| Paiute | 0.0 /100 | #317 | Tragic 13.7% |
| Cree | 0.0 /100 | #318 | Tragic 13.7% |
| Americans | 0.0 /100 | #319 | Tragic 13.8% |
| Tlingit-Haida | 0.0 /100 | #320 | Tragic 13.8% |
| Shoshone | 0.0 /100 | #321 | Tragic 13.8% |
| Apache | 0.0 /100 | #322 | Tragic 14.0% |
| Osage | 0.0 /100 | #323 | Tragic 14.0% |
| Comanche | 0.0 /100 | #324 | Tragic 14.1% |
| Ottawa | 0.0 /100 | #325 | Tragic 14.1% |
| Natives/Alaskans | 0.0 /100 | #326 | Tragic 14.2% |
| Potawatomi | 0.0 /100 | #327 | Tragic 14.2% |
| Chippewa | 0.0 /100 | #328 | Tragic 14.3% |
Shoshone Male Disability Correlation Summary
| Measurement | Shoshone Data | Male Disability Data |
| Minimum | 0.025% | 7.4% |
| Maximum | 81.5% | 37.6% |
| Range | 81.5% | 30.1% |
| Mean | 14.4% | 18.9% |
| Median | 6.0% | 17.1% |
| Interquartile 25% (IQ1) | 2.9% | 14.6% |
| Interquartile 75% (IQ3) | 18.7% | 22.7% |
| Interquartile Range (IQR) | 15.9% | 8.1% |
| Standard Deviation (Sample) | 19.9% | 6.5% |
| Standard Deviation (Population) | 19.7% | 6.4% |
Correlation Details
| Shoshone Percentile | Sample Size | Male Disability |
[ 0.0% - 0.5% ] 0.025% | 65,362,392 | 11.8% |
[ 0.0% - 0.5% ] 0.47% | 679,911 | 14.0% |
[ 0.5% - 1.0% ] 0.76% | 287,084 | 14.5% |
[ 1.0% - 1.5% ] 1.07% | 67,815 | 15.3% |
[ 1.0% - 1.5% ] 1.45% | 80,754 | 14.9% |
[ 1.5% - 2.0% ] 1.71% | 9,508 | 14.6% |
[ 2.0% - 2.5% ] 2.07% | 3,329 | 18.5% |
[ 2.0% - 2.5% ] 2.37% | 33,848 | 14.4% |
[ 2.5% - 3.0% ] 2.64% | 2,236 | 16.0% |
[ 3.0% - 3.5% ] 3.08% | 13,225 | 16.8% |
[ 3.0% - 3.5% ] 3.39% | 29,204 | 15.3% |
[ 3.5% - 4.0% ] 3.61% | 1,107 | 21.8% |
[ 3.5% - 4.0% ] 3.91% | 1,049 | 25.9% |
[ 4.0% - 4.5% ] 4.30% | 3,258 | 15.9% |
[ 4.5% - 5.0% ] 4.70% | 3,957 | 14.6% |
[ 5.0% - 5.5% ] 5.00% | 520 | 10.7% |
[ 5.0% - 5.5% ] 5.16% | 3,490 | 18.2% |
[ 5.5% - 6.0% ] 5.63% | 1,350 | 20.5% |
[ 5.5% - 6.0% ] 5.96% | 7,212 | 15.1% |
[ 6.0% - 6.5% ] 6.21% | 290 | 20.3% |
[ 6.5% - 7.0% ] 6.68% | 13,989 | 15.9% |
[ 7.0% - 7.5% ] 7.14% | 1,821 | 25.7% |
[ 7.0% - 7.5% ] 7.50% | 240 | 23.5% |
[ 8.5% - 9.0% ] 8.51% | 2,608 | 25.0% |
[ 8.5% - 9.0% ] 8.83% | 2,265 | 17.6% |
[ 11.5% - 12.0% ] 11.83% | 1,741 | 12.0% |
[ 14.0% - 14.5% ] 14.21% | 605 | 26.4% |
[ 18.0% - 18.5% ] 18.37% | 283 | 34.7% |
[ 19.0% - 19.5% ] 19.05% | 231 | 26.8% |
[ 21.0% - 21.5% ] 21.05% | 304 | 37.6% |
[ 23.0% - 23.5% ] 23.08% | 78 | 27.5% |
[ 30.0% - 30.5% ] 30.15% | 199 | 7.4% |
[ 36.5% - 37.0% ] 36.78% | 174 | 12.4% |
[ 42.0% - 42.5% ] 42.11% | 513 | 18.5% |
[ 63.5% - 64.0% ] 63.88% | 1,481 | 17.1% |
[ 68.0% - 68.5% ] 68.00% | 1,597 | 19.9% |
[ 81.5% - 82.0% ] 81.51% | 146 | 21.9% |