Shoshone Self-Care Disability

COMPARE

Shoshone
Race
Ancestry
AfghanAfricanAlaska NativeAlaskan AthabascanAlbanianAleutAlsatianAmericanApacheArabArapahoArgentineanArmenianAssyrian/Chaldean/SyriacAustralianAustrianBahamianBangladeshiBarbadianBasqueBelgianBelizeanBermudanBhutaneseBlackfeetBolivianBrazilianBritishBritish West IndianBulgarianBurmeseCajunCambodianCanadianCape VerdeanCarpatho RusynCelticCentral AmericanCentral American IndianCherokeeCheyenneChickasawChileanChineseChippewaChoctawColombianColvilleComancheCosta RicanCreeCreekCroatianCrowCubanCypriotCzechCzechoslovakianDanishDelawareDominicanDutchDutch West IndianEastern EuropeanEcuadorianEgyptianEnglishEstonianEthiopianEuropeanFijianFilipinoFinnishFrenchFrench American IndianFrench CanadianGermanGerman RussianGhanaianGreekGuamanian/ChamorroGuatemalanGuyaneseHaitianHmongHonduranHopiHoumaHungarianIcelanderIndian (Asian)IndonesianInupiatIranianIraqiIrishIroquoisIsraeliItalianJamaicanJapaneseJordanianKenyanKiowaKoreanLaotianLatvianLebaneseLiberianLithuanianLumbeeLuxembourgerMacedonianMalaysianMalteseMarshalleseMenomineeMexicanMexican American IndianMongolianMoroccanNative HawaiianNavajoNepaleseNew ZealanderNicaraguanNigerianNorthern EuropeanNorwegianOkinawanOsageOttawaPaiutePakistaniPalestinianPanamanianParaguayanPennsylvania GermanPeruvianPimaPolishPortuguesePotawatomiPuebloPuerto RicanPuget Sound SalishRomanianRussianSalvadoranSamoanScandinavianScotch-IrishScottishSeminoleSenegaleseSerbianShoshoneSierra LeoneanSiouxSlavicSlovakSloveneSomaliSouth AfricanSouth AmericanSouth American IndianSoviet UnionSpaniardSpanishSpanish AmericanSpanish American IndianSri LankanSubsaharan AfricanSudaneseSwedishSwissSyrianTaiwaneseThaiTlingit-HaidaTohono O'OdhamTonganTrinidadian and TobagonianTsimshianTurkishU.S. Virgin IslanderUgandanUkrainianUruguayanUteVenezuelanVietnameseWelshWest IndianYakamaYaquiYugoslavianYumanYup'ikZimbabwean
Immigration
NonimmigrantsImmigrantsAfghanistanAfricaAlbaniaArgentinaArmeniaAsiaAustraliaAustriaBahamasBangladeshBarbadosBelarusBelgiumBelizeBoliviaBosnia and HerzegovinaBrazilBulgariaBurma/MyanmarCabo VerdeCambodiaCameroonCanadaCaribbeanCentral AmericaChileChinaColombiaCongoCosta RicaCroatiaCubaCzechoslovakiaDenmarkDominicaDominican RepublicEastern AfricaEastern AsiaEastern EuropeEcuadorEgyptEl SalvadorEnglandEritreaEthiopiaEuropeFijiFranceGermanyGhanaGreeceGrenadaGuatemalaGuyanaHaitiHondurasHong KongHungaryIndiaIndonesiaIranIraqIrelandIsraelItalyJamaicaJapanJordanKazakhstanKenyaKoreaKuwaitLaosLatin AmericaLatviaLebanonLiberiaLithuaniaMalaysiaMexicoMicronesiaMiddle AfricaMoldovaMoroccoNepalNetherlandsNicaraguaNigeriaNorth AmericaNorth MacedoniaNorthern AfricaNorthern EuropeNorwayOceaniaPakistanPanamaPeruPhilippinesPolandPortugalRomaniaRussiaSaudi ArabiaScotlandSenegalSerbiaSierra LeoneSingaporeSomaliaSouth AfricaSouth AmericaSouth Central AsiaSouth Eastern AsiaSouthern EuropeSpainSri LankaSt. Vincent and the GrenadinesSudanSwedenSwitzerlandSyriaTaiwanThailandTrinidad and TobagoTurkeyUgandaUkraineUruguayUzbekistanVenezuelaVietnamWest IndiesWestern AfricaWestern AsiaWestern EuropeYemenZaireZimbabweAzores
Select to Compare
Race
Ancestry
AfghanAfricanAlaska NativeAlaskan AthabascanAlbanianAleutAlsatianAmericanApacheArabArapahoArgentineanArmenianAssyrian/Chaldean/SyriacAustralianAustrianBahamianBangladeshiBarbadianBasqueBelgianBelizeanBermudanBhutaneseBlackfeetBolivianBrazilianBritishBritish West IndianBulgarianBurmeseCajunCambodianCanadianCape VerdeanCarpatho RusynCelticCentral AmericanCentral American IndianCherokeeCheyenneChickasawChileanChineseChippewaChoctawColombianColvilleComancheCosta RicanCreeCreekCroatianCrowCubanCypriotCzechCzechoslovakianDanishDelawareDominicanDutchDutch West IndianEastern EuropeanEcuadorianEgyptianEnglishEstonianEthiopianEuropeanFijianFilipinoFinnishFrenchFrench American IndianFrench CanadianGermanGerman RussianGhanaianGreekGuamanian/ChamorroGuatemalanGuyaneseHaitianHmongHonduranHopiHoumaHungarianIcelanderIndian (Asian)IndonesianInupiatIranianIraqiIrishIroquoisIsraeliItalianJamaicanJapaneseJordanianKenyanKiowaKoreanLaotianLatvianLebaneseLiberianLithuanianLumbeeLuxembourgerMacedonianMalaysianMalteseMarshalleseMenomineeMexicanMexican American IndianMongolianMoroccanNative HawaiianNavajoNepaleseNew ZealanderNicaraguanNigerianNorthern EuropeanNorwegianOkinawanOsageOttawaPaiutePakistaniPalestinianPanamanianParaguayanPennsylvania GermanPeruvianPimaPolishPortuguesePotawatomiPuebloPuerto RicanPuget Sound SalishRomanianRussianSalvadoranSamoanScandinavianScotch-IrishScottishSeminoleSenegaleseSerbianSierra LeoneanSiouxSlavicSlovakSloveneSomaliSouth AfricanSouth AmericanSouth American IndianSoviet UnionSpaniardSpanishSpanish AmericanSpanish American IndianSri LankanSubsaharan AfricanSudaneseSwedishSwissSyrianTaiwaneseThaiTlingit-HaidaTohono O'OdhamTonganTrinidadian and TobagonianTsimshianTurkishU.S. Virgin IslanderUgandanUkrainianUruguayanUteVenezuelanVietnameseWelshWest IndianYakamaYaquiYugoslavianYumanYup'ikZimbabwean
Immigration
NonimmigrantsImmigrantsAfghanistanAfricaAlbaniaArgentinaArmeniaAsiaAustraliaAustriaBahamasBangladeshBarbadosBelarusBelgiumBelizeBoliviaBosnia and HerzegovinaBrazilBulgariaBurma/MyanmarCabo VerdeCambodiaCameroonCanadaCaribbeanCentral AmericaChileChinaColombiaCongoCosta RicaCroatiaCubaCzechoslovakiaDenmarkDominicaDominican RepublicEastern AfricaEastern AsiaEastern EuropeEcuadorEgyptEl SalvadorEnglandEritreaEthiopiaEuropeFijiFranceGermanyGhanaGreeceGrenadaGuatemalaGuyanaHaitiHondurasHong KongHungaryIndiaIndonesiaIranIraqIrelandIsraelItalyJamaicaJapanJordanKazakhstanKenyaKoreaKuwaitLaosLatin AmericaLatviaLebanonLiberiaLithuaniaMalaysiaMexicoMicronesiaMiddle AfricaMoldovaMoroccoNepalNetherlandsNicaraguaNigeriaNorth AmericaNorth MacedoniaNorthern AfricaNorthern EuropeNorwayOceaniaPakistanPanamaPeruPhilippinesPolandPortugalRomaniaRussiaSaudi ArabiaScotlandSenegalSerbiaSierra LeoneSingaporeSomaliaSouth AfricaSouth AmericaSouth Central AsiaSouth Eastern AsiaSouthern EuropeSpainSri LankaSt. Vincent and the GrenadinesSudanSwedenSwitzerlandSyriaTaiwanThailandTrinidad and TobagoTurkeyUgandaUkraineUruguayUzbekistanVenezuelaVietnamWest IndiesWestern AfricaWestern AsiaWestern EuropeYemenZaireZimbabweAzores
Self-Care Disability
Income
Poverty
Unemployment
Labor Participation
Family Structure
Vehicle Availability
Education Level
Disability

Shoshone Self-Care Disability
Tragic

2.7%
SELF-CARE DISABILITY
0.2/ 100
METRIC RATING
262nd/ 347
METRIC RANK

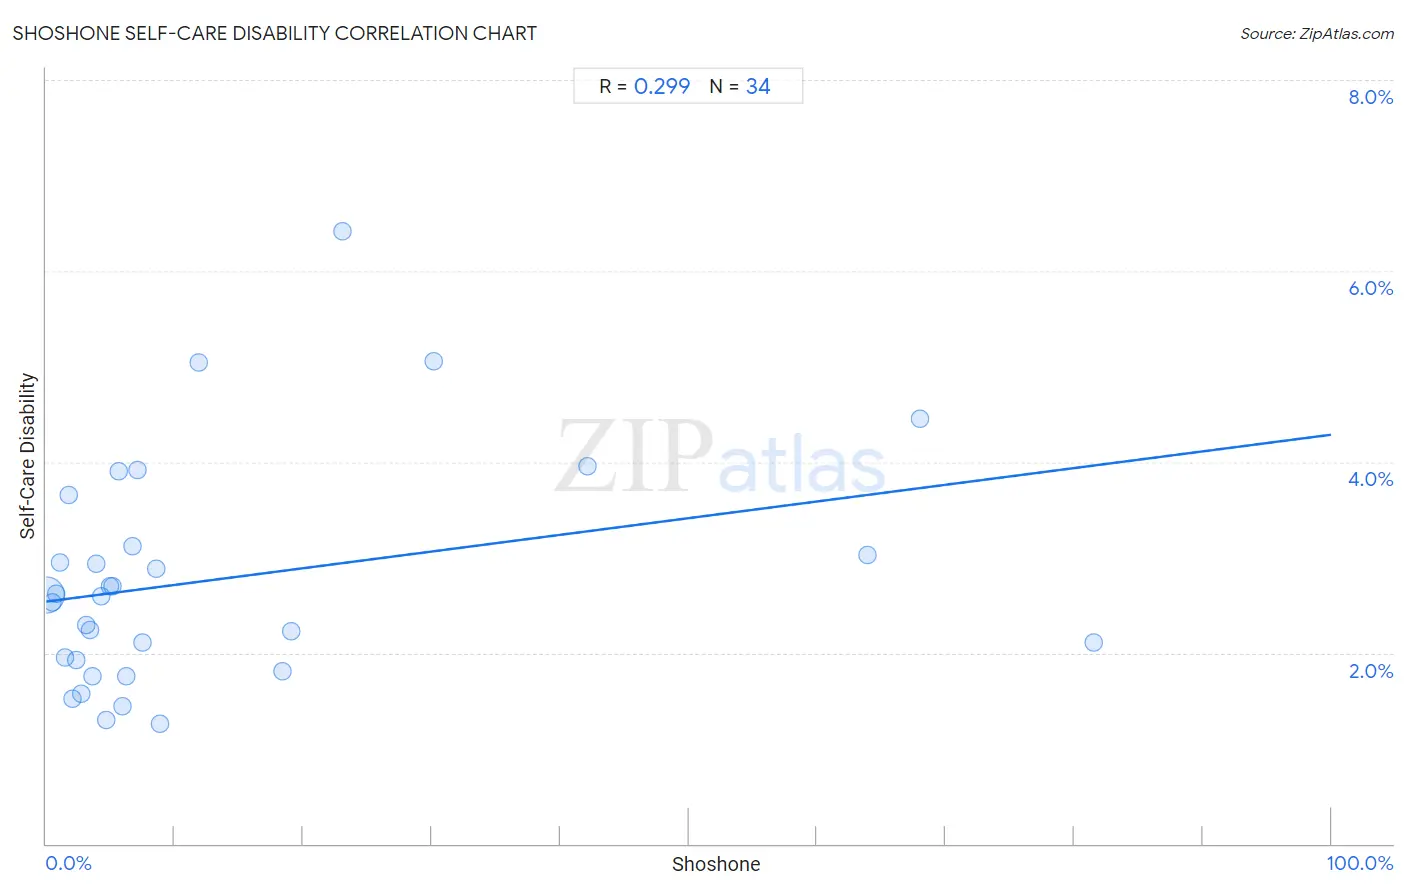
Shoshone Self-Care Disability Correlation Chart

The statistical analysis conducted on geographies consisting of 66,602,843 people shows a weak positive correlation between the proportion of Shoshone and percentage of population with self-care disability in the United States with a correlation coefficient (R) of 0.299 and weighted average of 2.7%. On average, for every 1% (one percent) increase in Shoshone within a typical geography, there is an increase of 0.017% in percentage of population with self-care disability.
Shoshone Self-Care Disability
It is essential to understand that the correlation between the percentage of Shoshone and percentage of population with self-care disability does not imply a direct cause-and-effect relationship. It remains uncertain whether the presence of Shoshone influences an upward or downward trend in the level of percentage of population with self-care disability within an area, or if Shoshone simply ended up residing in those areas with higher or lower levels of percentage of population with self-care disability due to other factors.

Demographics Similar to Shoshone by Self-Care Disability

In terms of self-care disability, the demographic groups most similar to Shoshone are Immigrants from Latin America (2.7%, a difference of 0.070%), Immigrants from Iran (2.7%, a difference of 0.13%), Arapaho (2.6%, a difference of 0.14%), Chippewa (2.6%, a difference of 0.16%), and Immigrants from Belarus (2.6%, a difference of 0.20%).
DemographicsRating | RankSelf-Care Disability
Tsimshian
0.3
/100
|
#255
Tragic
2.6%
Immigrants from Central America
0.3
/100
|
#256
Tragic
2.6%
Potawatomi
0.3
/100
|
#257
Tragic
2.6%
Nonimmigrants
0.3
/100
|
#258
Tragic
2.6%
Immigrants from Belarus
0.2
/100
|
#259
Tragic
2.6%
Chippewa
0.2
/100
|
#260
Tragic
2.6%
Arapaho
0.2
/100
|
#261
Tragic
2.6%
Shoshone
0.2
/100
|
#262
Tragic
2.7%
Immigrants from Latin America
0.2
/100
|
#263
Tragic
2.7%
Immigrants from Iran
0.2
/100
|
#264
Tragic
2.7%
Immigrants from Nicaragua
0.2
/100
|
#265
Tragic
2.7%
Immigrants from Cambodia
0.1
/100
|
#266
Tragic
2.7%
Yaqui
0.1
/100
|
#267
Tragic
2.7%
Immigrants from Mexico
0.1
/100
|
#268
Tragic
2.7%
U.S. Virgin Islanders
0.1
/100
|
#269
Tragic
2.7%

Shoshone Self-Care Disability Correlation Summary

MeasurementShoshone DataSelf-Care Disability Data
Minimum0.025%1.3%
Maximum81.5%6.4%
Range81.5%5.2%
Mean13.5%2.8%
Median5.4%2.6%
Interquartile 25% (IQ1)2.8%1.9%
Interquartile 75% (IQ3)11.8%3.1%
Interquartile Range (IQR)9.1%1.2%
Standard Deviation (Sample)20.4%1.2%
Standard Deviation (Population)20.1%1.2%

Correlation Details

Shoshone PercentileSample SizeSelf-Care Disability
[
0.0%
-
0.5%
]
0.025%
65,356,6682.6%
[
0.0%
-
0.5%
]
0.47%
674,2212.5%
[
0.5%
-
1.0%
]
0.76%
286,4442.6%
[
1.0%
-
1.5%
]
1.07%
67,8152.9%
[
1.0%
-
1.5%
]
1.45%
80,2432.0%
[
1.5%
-
2.0%
]
1.71%
9,5083.7%
[
2.0%
-
2.5%
]
2.08%
3,0261.5%
[
2.0%
-
2.5%
]
2.37%
33,8481.9%
[
2.5%
-
3.0%
]
2.76%
9061.6%
[
3.0%
-
3.5%
]
3.08%
13,2252.3%
[
3.0%
-
3.5%
]
3.40%
28,1472.2%
[
3.5%
-
4.0%
]
3.61%
1,1071.8%
[
3.5%
-
4.0%
]
3.91%
8452.9%
[
4.0%
-
4.5%
]
4.28%
2,8292.6%
[
4.5%
-
5.0%
]
4.70%
3,9571.3%
[
5.0%
-
5.5%
]
5.00%
5202.7%
[
5.0%
-
5.5%
]
5.16%
3,4902.7%
[
5.5%
-
6.0%
]
5.63%
1,3503.9%
[
5.5%
-
6.0%
]
5.96%
7,2121.4%
[
6.0%
-
6.5%
]
6.21%
2901.7%
[
6.5%
-
7.0%
]
6.68%
13,9893.1%
[
7.0%
-
7.5%
]
7.14%
1,8213.9%
[
7.0%
-
7.5%
]
7.50%
2402.1%
[
8.5%
-
9.0%
]
8.51%
2,6082.9%
[
8.5%
-
9.0%
]
8.83%
2,2651.3%
[
11.5%
-
12.0%
]
11.83%
1,7415.0%
[
18.0%
-
18.5%
]
18.37%
2831.8%
[
19.0%
-
19.5%
]
19.05%
2312.2%
[
23.0%
-
23.5%
]
23.08%
786.4%
[
30.0%
-
30.5%
]
30.15%
1995.1%
[
42.0%
-
42.5%
]
42.11%
5134.0%
[
63.5%
-
64.0%
]
63.88%
1,4813.0%
[
68.0%
-
68.5%
]
68.00%
1,5974.5%
[
81.5%
-
82.0%
]
81.51%
1462.1%