Shoshone Unemployment Among Women with Children Ages 6 to 17 years
COMPARE
Shoshone
Select to Compare
Unemployment Among Women with Children Ages 6 to 17 years
Shoshone Unemployment Among Women with Children Ages 6 to 17 years
10.0%
UNEMPLOYMENT | WOMEN W/ CHILDREN 6 TO 17
0.0/ 100
METRIC RATING
288th/ 347
METRIC RANK
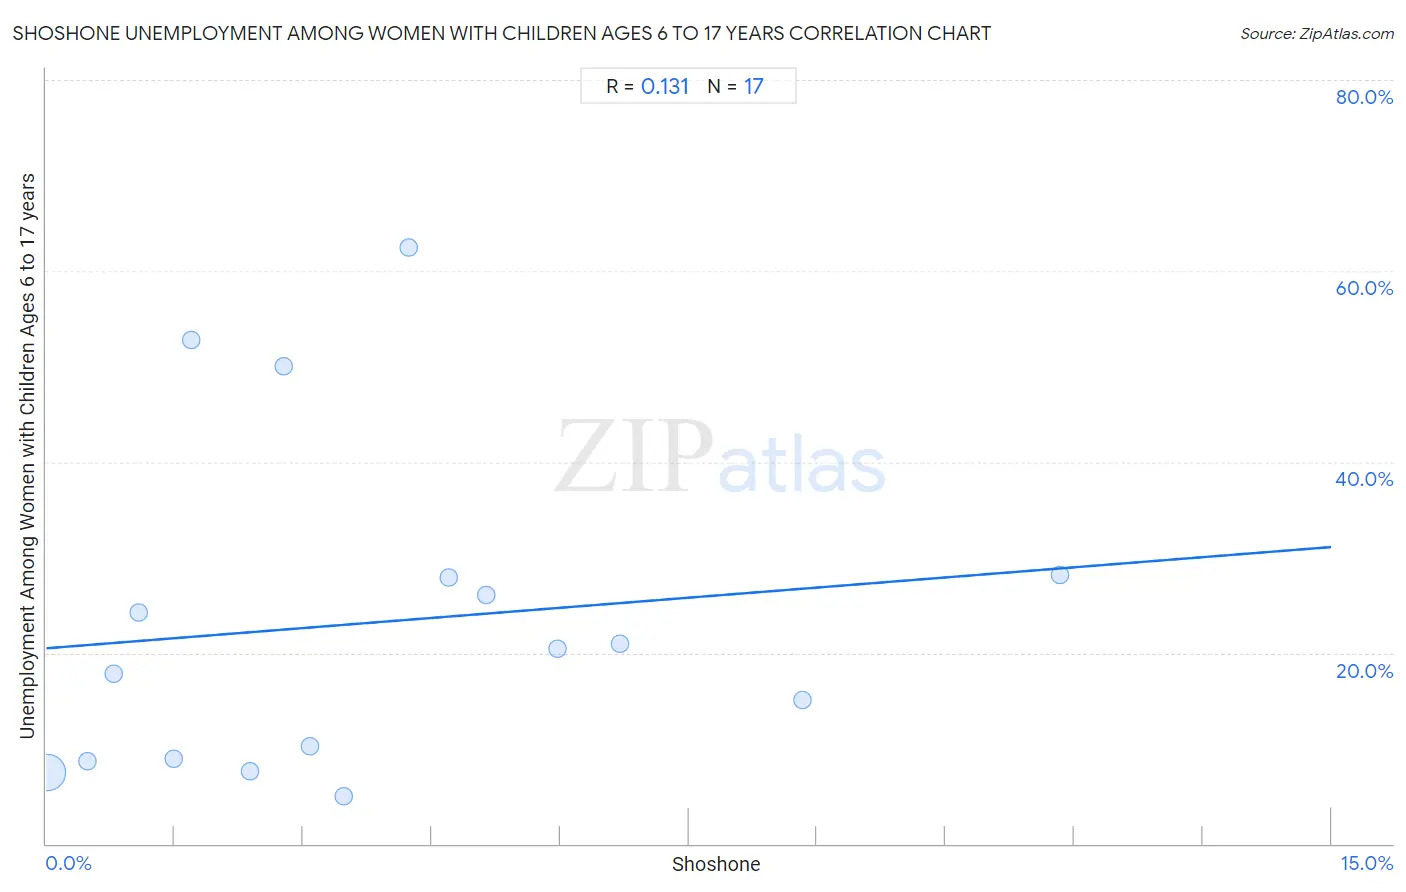
Shoshone Unemployment Among Women with Children Ages 6 to 17 years Correlation Chart
The statistical analysis conducted on geographies consisting of 59,556,490 people shows a poor positive correlation between the proportion of Shoshone and unemployment rate among women with children between the ages 6 and 17 in the United States with a correlation coefficient (R) of 0.131 and weighted average of 10.0%. On average, for every 1% (one percent) increase in Shoshone within a typical geography, there is an increase of 0.71% in unemployment rate among women with children between the ages 6 and 17.
It is essential to understand that the correlation between the percentage of Shoshone and unemployment rate among women with children between the ages 6 and 17 does not imply a direct cause-and-effect relationship. It remains uncertain whether the presence of Shoshone influences an upward or downward trend in the level of unemployment rate among women with children between the ages 6 and 17 within an area, or if Shoshone simply ended up residing in those areas with higher or lower levels of unemployment rate among women with children between the ages 6 and 17 due to other factors.
Demographics Similar to Shoshone by Unemployment Among Women with Children Ages 6 to 17 years
In terms of unemployment among women with children ages 6 to 17 years, the demographic groups most similar to Shoshone are Sierra Leonean (9.9%, a difference of 0.24%), Choctaw (9.9%, a difference of 0.29%), Hispanic or Latino (9.9%, a difference of 0.41%), Honduran (10.0%, a difference of 0.43%), and Subsaharan African (10.0%, a difference of 0.44%).
| Demographics | Rating | Rank | Unemployment Among Women with Children Ages 6 to 17 years |
| Jamaicans | 0.0 /100 | #281 | Tragic 9.8% |
| Slovaks | 0.0 /100 | #282 | Tragic 9.8% |
| Central American Indians | 0.0 /100 | #283 | Tragic 9.9% |
| Yakama | 0.0 /100 | #284 | Tragic 9.9% |
| Hispanics or Latinos | 0.0 /100 | #285 | Tragic 9.9% |
| Choctaw | 0.0 /100 | #286 | Tragic 9.9% |
| Sierra Leoneans | 0.0 /100 | #287 | Tragic 9.9% |
| Shoshone | 0.0 /100 | #288 | Tragic 10.0% |
| Hondurans | 0.0 /100 | #289 | Tragic 10.0% |
| Sub-Saharan Africans | 0.0 /100 | #290 | Tragic 10.0% |
| Nonimmigrants | 0.0 /100 | #291 | Tragic 10.0% |
| Carpatho Rusyns | 0.0 /100 | #292 | Tragic 10.0% |
| Haitians | 0.0 /100 | #293 | Tragic 10.0% |
| Ecuadorians | 0.0 /100 | #294 | Tragic 10.0% |
| Cherokee | 0.0 /100 | #295 | Tragic 10.0% |
Shoshone Unemployment Among Women with Children Ages 6 to 17 years Correlation Summary
| Measurement | Shoshone Data | Unemployment Among Women with Children Ages 6 to 17 years Data |
| Minimum | 0.020% | 5.0% |
| Maximum | 11.8% | 62.5% |
| Range | 11.8% | 57.5% |
| Mean | 3.8% | 23.2% |
| Median | 3.1% | 20.4% |
| Interquartile 25% (IQ1) | 1.3% | 8.8% |
| Interquartile 75% (IQ3) | 5.6% | 28.1% |
| Interquartile Range (IQR) | 4.3% | 19.2% |
| Standard Deviation (Sample) | 3.2% | 17.2% |
| Standard Deviation (Population) | 3.1% | 16.6% |
Correlation Details
| Shoshone Percentile | Sample Size | Unemployment Among Women with Children Ages 6 to 17 years |
[ 0.0% - 0.5% ] 0.020% | 58,986,446 | 7.5% |
[ 0.0% - 0.5% ] 0.48% | 359,892 | 8.7% |
[ 0.5% - 1.0% ] 0.78% | 71,340 | 17.8% |
[ 1.0% - 1.5% ] 1.07% | 11,261 | 24.2% |
[ 1.0% - 1.5% ] 1.49% | 35,109 | 8.9% |
[ 1.5% - 2.0% ] 1.69% | 5,570 | 52.8% |
[ 2.0% - 2.5% ] 2.37% | 26,023 | 7.6% |
[ 2.5% - 3.0% ] 2.78% | 360 | 50.0% |
[ 3.0% - 3.5% ] 3.07% | 10,733 | 10.2% |
[ 3.0% - 3.5% ] 3.47% | 18,898 | 5.0% |
[ 4.0% - 4.5% ] 4.24% | 1,109 | 62.5% |
[ 4.5% - 5.0% ] 4.70% | 3,957 | 27.9% |
[ 5.0% - 5.5% ] 5.14% | 1,596 | 26.1% |
[ 5.5% - 6.0% ] 5.96% | 7,212 | 20.4% |
[ 6.5% - 7.0% ] 6.70% | 13,248 | 20.9% |
[ 8.5% - 9.0% ] 8.83% | 2,265 | 15.1% |
[ 11.5% - 12.0% ] 11.83% | 1,471 | 28.2% |