Senegalese Disability
COMPARE
Senegalese
Select to Compare
Disability
Senegalese Disability
12.1%
DISABILITY
3.5/ 100
METRIC RATING
225th/ 347
METRIC RANK
Senegalese Disability Correlation Chart
The statistical analysis conducted on geographies consisting of 78,141,203 people shows a slight positive correlation between the proportion of Senegalese and percentage of population with a disability in the United States with a correlation coefficient (R) of 0.064 and weighted average of 12.1%. On average, for every 1% (one percent) increase in Senegalese within a typical geography, there is an increase of 0.16% in percentage of population with a disability.
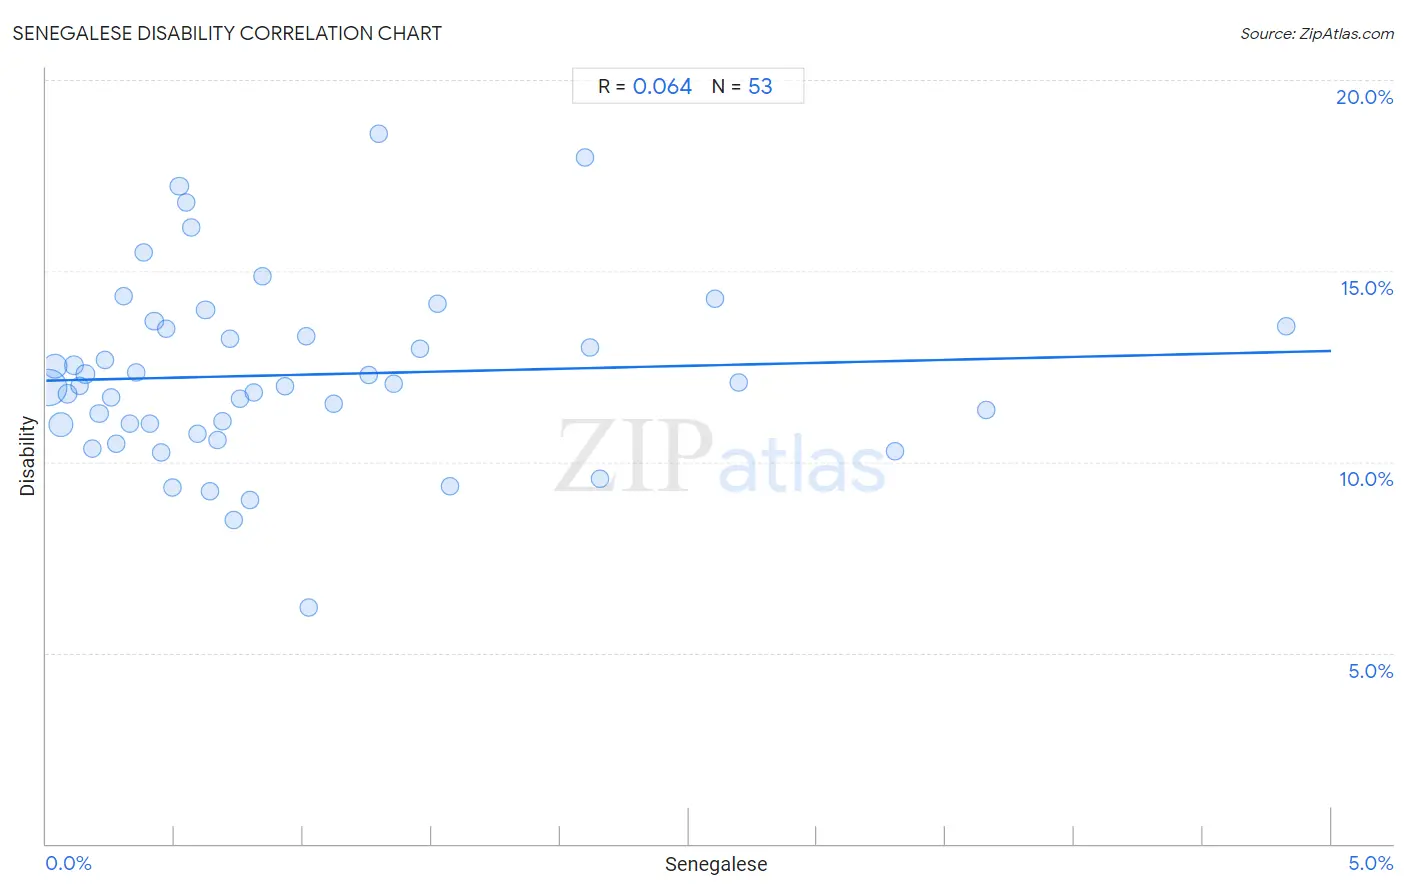
It is essential to understand that the correlation between the percentage of Senegalese and percentage of population with a disability does not imply a direct cause-and-effect relationship. It remains uncertain whether the presence of Senegalese influences an upward or downward trend in the level of percentage of population with a disability within an area, or if Senegalese simply ended up residing in those areas with higher or lower levels of percentage of population with a disability due to other factors.
Demographics Similar to Senegalese by Disability
In terms of disability, the demographic groups most similar to Senegalese are Jamaican (12.1%, a difference of 0.050%), Alsatian (12.1%, a difference of 0.060%), Mexican (12.1%, a difference of 0.080%), Hispanic or Latino (12.1%, a difference of 0.15%), and Spanish American Indian (12.1%, a difference of 0.18%).
| Demographics | Rating | Rank | Disability |
| Immigrants from Jamaica | 5.0 /100 | #218 | Tragic 12.1% |
| Croatians | 4.9 /100 | #219 | Tragic 12.1% |
| Immigrants from Bahamas | 4.7 /100 | #220 | Tragic 12.1% |
| Northern Europeans | 4.2 /100 | #221 | Tragic 12.1% |
| Spanish American Indians | 4.1 /100 | #222 | Tragic 12.1% |
| Hispanics or Latinos | 3.9 /100 | #223 | Tragic 12.1% |
| Mexicans | 3.7 /100 | #224 | Tragic 12.1% |
| Senegalese | 3.5 /100 | #225 | Tragic 12.1% |
| Jamaicans | 3.3 /100 | #226 | Tragic 12.1% |
| Alsatians | 3.3 /100 | #227 | Tragic 12.1% |
| West Indians | 2.9 /100 | #228 | Tragic 12.2% |
| Inupiat | 2.8 /100 | #229 | Tragic 12.2% |
| Samoans | 2.6 /100 | #230 | Tragic 12.2% |
| Malaysians | 2.5 /100 | #231 | Tragic 12.2% |
| Italians | 2.5 /100 | #232 | Tragic 12.2% |
Senegalese Disability Correlation Summary
| Measurement | Senegalese Data | Disability Data |
| Minimum | 0.0093% | 6.2% |
| Maximum | 4.8% | 18.6% |
| Range | 4.8% | 12.4% |
| Mean | 0.96% | 12.3% |
| Median | 0.64% | 12.0% |
| Interquartile 25% (IQ1) | 0.31% | 10.9% |
| Interquartile 75% (IQ3) | 1.3% | 13.5% |
| Interquartile Range (IQR) | 0.96% | 2.6% |
| Standard Deviation (Sample) | 0.99% | 2.4% |
| Standard Deviation (Population) | 0.98% | 2.4% |
Correlation Details
| Senegalese Percentile | Sample Size | Disability |
[ 0.0% - 0.5% ] 0.0093% | 37,948,712 | 11.9% |
[ 0.0% - 0.5% ] 0.036% | 12,844,543 | 12.5% |
[ 0.0% - 0.5% ] 0.057% | 14,089,089 | 11.0% |
[ 0.0% - 0.5% ] 0.085% | 2,414,673 | 11.8% |
[ 0.0% - 0.5% ] 0.11% | 1,649,427 | 12.5% |
[ 0.0% - 0.5% ] 0.13% | 1,645,295 | 12.0% |
[ 0.0% - 0.5% ] 0.15% | 1,153,962 | 12.3% |
[ 0.0% - 0.5% ] 0.18% | 605,563 | 10.3% |
[ 0.0% - 0.5% ] 0.21% | 752,728 | 11.3% |
[ 0.0% - 0.5% ] 0.23% | 268,858 | 12.7% |
[ 0.0% - 0.5% ] 0.25% | 551,241 | 11.7% |
[ 0.0% - 0.5% ] 0.27% | 111,101 | 10.5% |
[ 0.0% - 0.5% ] 0.30% | 346,652 | 14.3% |
[ 0.0% - 0.5% ] 0.33% | 411,765 | 11.0% |
[ 0.0% - 0.5% ] 0.35% | 302,379 | 12.3% |
[ 0.0% - 0.5% ] 0.38% | 204,088 | 15.5% |
[ 0.0% - 0.5% ] 0.40% | 353,113 | 11.0% |
[ 0.0% - 0.5% ] 0.42% | 286,619 | 13.7% |
[ 0.0% - 0.5% ] 0.45% | 363,359 | 10.3% |
[ 0.0% - 0.5% ] 0.47% | 124,750 | 13.5% |
[ 0.0% - 0.5% ] 0.49% | 83,875 | 9.3% |
[ 0.5% - 1.0% ] 0.52% | 217,823 | 17.2% |
[ 0.5% - 1.0% ] 0.54% | 137,459 | 16.8% |
[ 0.5% - 1.0% ] 0.56% | 51,282 | 16.1% |
[ 0.5% - 1.0% ] 0.59% | 27,128 | 10.8% |
[ 0.5% - 1.0% ] 0.62% | 307,740 | 14.0% |
[ 0.5% - 1.0% ] 0.64% | 96,706 | 9.2% |
[ 0.5% - 1.0% ] 0.67% | 22,196 | 10.6% |
[ 0.5% - 1.0% ] 0.69% | 116,386 | 11.0% |
[ 0.5% - 1.0% ] 0.71% | 67,444 | 13.2% |
[ 0.5% - 1.0% ] 0.73% | 56,556 | 8.5% |
[ 0.5% - 1.0% ] 0.75% | 110,916 | 11.6% |
[ 0.5% - 1.0% ] 0.79% | 18,067 | 9.0% |
[ 0.5% - 1.0% ] 0.81% | 53,660 | 11.8% |
[ 0.5% - 1.0% ] 0.84% | 31,999 | 14.8% |
[ 0.5% - 1.0% ] 0.93% | 38,053 | 12.0% |
[ 1.0% - 1.5% ] 1.01% | 67,945 | 13.3% |
[ 1.0% - 1.5% ] 1.02% | 33,252 | 6.2% |
[ 1.0% - 1.5% ] 1.12% | 30,917 | 11.5% |
[ 1.0% - 1.5% ] 1.25% | 10,527 | 12.3% |
[ 1.0% - 1.5% ] 1.29% | 40,243 | 18.6% |
[ 1.0% - 1.5% ] 1.35% | 18,613 | 12.1% |
[ 1.0% - 1.5% ] 1.45% | 2,204 | 13.0% |
[ 1.5% - 2.0% ] 1.52% | 13,873 | 14.1% |
[ 1.5% - 2.0% ] 1.57% | 19,069 | 9.4% |
[ 2.0% - 2.5% ] 2.10% | 1,525 | 18.0% |
[ 2.0% - 2.5% ] 2.11% | 9,415 | 13.0% |
[ 2.0% - 2.5% ] 2.15% | 5,708 | 9.5% |
[ 2.5% - 3.0% ] 2.60% | 9,873 | 14.3% |
[ 2.5% - 3.0% ] 2.69% | 1,002 | 12.1% |
[ 3.0% - 3.5% ] 3.30% | 3,575 | 10.3% |
[ 3.5% - 4.0% ] 3.66% | 3,365 | 11.4% |
[ 4.5% - 5.0% ] 4.83% | 4,890 | 13.5% |