Senegalese Self-Care Disability
COMPARE
Senegalese
Select to Compare
Self-Care Disability
Senegalese Self-Care Disability
2.6%
SELF-CARE DISABILITY
1.3/ 100
METRIC RATING
238th/ 347
METRIC RANK
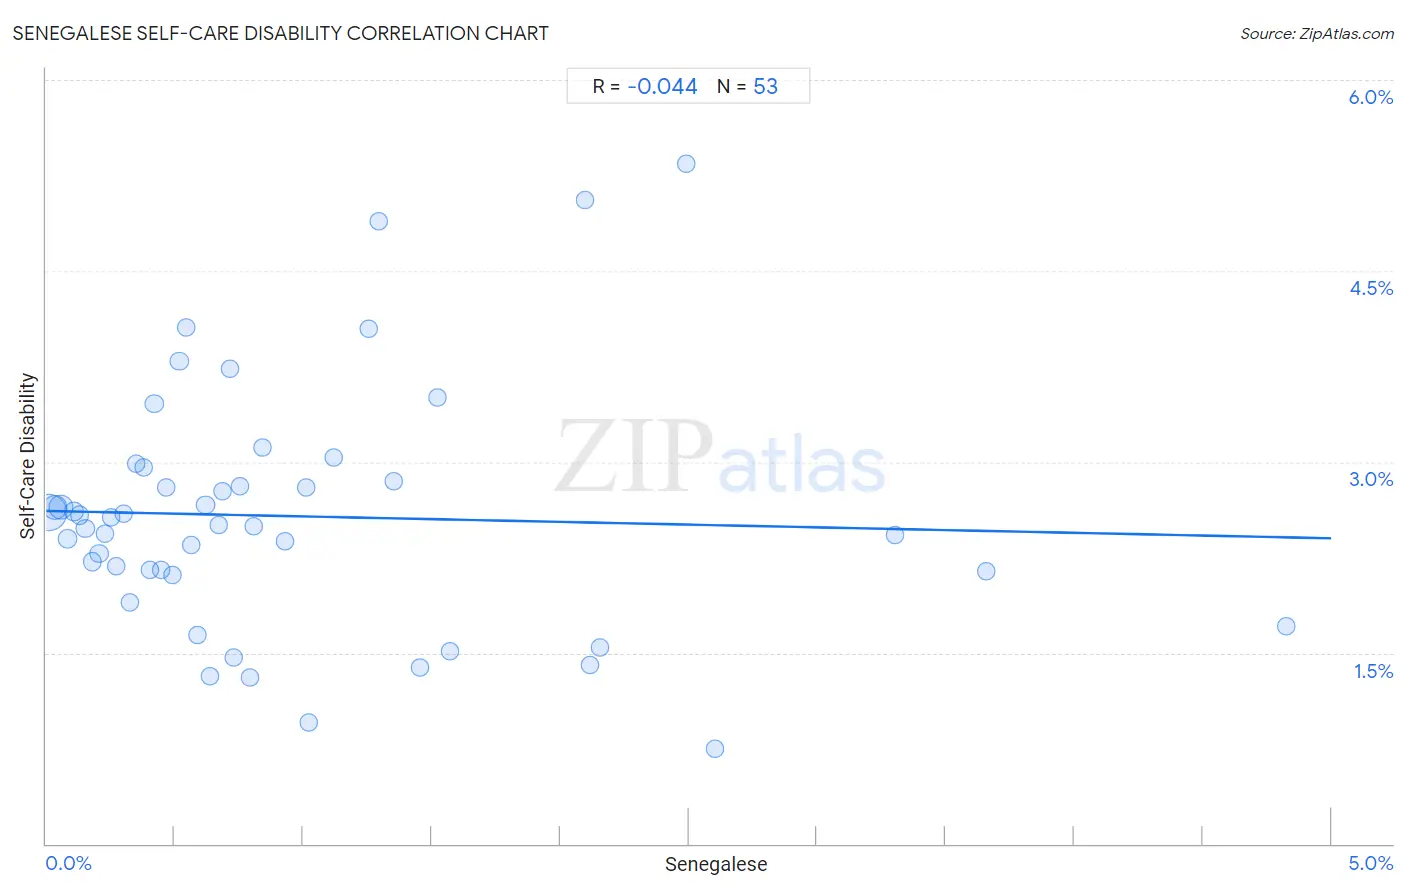
Senegalese Self-Care Disability Correlation Chart
The statistical analysis conducted on geographies consisting of 78,103,112 people shows no correlation between the proportion of Senegalese and percentage of population with self-care disability in the United States with a correlation coefficient (R) of -0.044 and weighted average of 2.6%. On average, for every 1% (one percent) increase in Senegalese within a typical geography, there is a decrease of 0.043% in percentage of population with self-care disability.
It is essential to understand that the correlation between the percentage of Senegalese and percentage of population with self-care disability does not imply a direct cause-and-effect relationship. It remains uncertain whether the presence of Senegalese influences an upward or downward trend in the level of percentage of population with self-care disability within an area, or if Senegalese simply ended up residing in those areas with higher or lower levels of percentage of population with self-care disability due to other factors.
Demographics Similar to Senegalese by Self-Care Disability
In terms of self-care disability, the demographic groups most similar to Senegalese are Immigrants from Panama (2.6%, a difference of 0.040%), Marshallese (2.6%, a difference of 0.070%), Immigrants from Syria (2.6%, a difference of 0.24%), Immigrants from Senegal (2.6%, a difference of 0.26%), and Bermudan (2.6%, a difference of 0.46%).
| Demographics | Rating | Rank | Self-Care Disability |
| Immigrants from Guatemala | 2.2 /100 | #231 | Tragic 2.6% |
| Albanians | 2.2 /100 | #232 | Tragic 2.6% |
| Liberians | 2.1 /100 | #233 | Tragic 2.6% |
| Vietnamese | 2.1 /100 | #234 | Tragic 2.6% |
| Bahamians | 2.0 /100 | #235 | Tragic 2.6% |
| Bermudans | 1.9 /100 | #236 | Tragic 2.6% |
| Immigrants from Senegal | 1.6 /100 | #237 | Tragic 2.6% |
| Senegalese | 1.3 /100 | #238 | Tragic 2.6% |
| Immigrants from Panama | 1.2 /100 | #239 | Tragic 2.6% |
| Marshallese | 1.2 /100 | #240 | Tragic 2.6% |
| Immigrants from Syria | 1.0 /100 | #241 | Tragic 2.6% |
| Spanish | 0.8 /100 | #242 | Tragic 2.6% |
| Hawaiians | 0.8 /100 | #243 | Tragic 2.6% |
| Yuman | 0.8 /100 | #244 | Tragic 2.6% |
| Immigrants from Western Asia | 0.6 /100 | #245 | Tragic 2.6% |
Senegalese Self-Care Disability Correlation Summary
| Measurement | Senegalese Data | Self-Care Disability Data |
| Minimum | 0.0093% | 0.74% |
| Maximum | 4.8% | 5.3% |
| Range | 4.8% | 4.6% |
| Mean | 0.95% | 2.6% |
| Median | 0.64% | 2.5% |
| Interquartile 25% (IQ1) | 0.31% | 2.1% |
| Interquartile 75% (IQ3) | 1.3% | 2.9% |
| Interquartile Range (IQR) | 0.96% | 0.77% |
| Standard Deviation (Sample) | 0.98% | 0.96% |
| Standard Deviation (Population) | 0.97% | 0.95% |
Correlation Details
| Senegalese Percentile | Sample Size | Self-Care Disability |
[ 0.0% - 0.5% ] 0.0093% | 37,948,712 | 2.6% |
[ 0.0% - 0.5% ] 0.036% | 12,832,554 | 2.6% |
[ 0.0% - 0.5% ] 0.057% | 14,089,089 | 2.6% |
[ 0.0% - 0.5% ] 0.085% | 2,414,673 | 2.4% |
[ 0.0% - 0.5% ] 0.11% | 1,649,427 | 2.6% |
[ 0.0% - 0.5% ] 0.13% | 1,645,295 | 2.6% |
[ 0.0% - 0.5% ] 0.15% | 1,153,962 | 2.5% |
[ 0.0% - 0.5% ] 0.18% | 603,849 | 2.2% |
[ 0.0% - 0.5% ] 0.21% | 746,943 | 2.3% |
[ 0.0% - 0.5% ] 0.23% | 268,858 | 2.4% |
[ 0.0% - 0.5% ] 0.25% | 551,241 | 2.6% |
[ 0.0% - 0.5% ] 0.27% | 111,101 | 2.2% |
[ 0.0% - 0.5% ] 0.30% | 346,652 | 2.6% |
[ 0.0% - 0.5% ] 0.33% | 411,765 | 1.9% |
[ 0.0% - 0.5% ] 0.35% | 294,607 | 3.0% |
[ 0.0% - 0.5% ] 0.38% | 204,088 | 3.0% |
[ 0.0% - 0.5% ] 0.40% | 353,113 | 2.2% |
[ 0.0% - 0.5% ] 0.42% | 286,619 | 3.5% |
[ 0.0% - 0.5% ] 0.45% | 363,359 | 2.2% |
[ 0.0% - 0.5% ] 0.47% | 122,661 | 2.8% |
[ 0.0% - 0.5% ] 0.49% | 83,875 | 2.1% |
[ 0.5% - 1.0% ] 0.52% | 217,823 | 3.8% |
[ 0.5% - 1.0% ] 0.54% | 137,459 | 4.1% |
[ 0.5% - 1.0% ] 0.56% | 51,282 | 2.3% |
[ 0.5% - 1.0% ] 0.59% | 24,380 | 1.6% |
[ 0.5% - 1.0% ] 0.62% | 307,740 | 2.7% |
[ 0.5% - 1.0% ] 0.64% | 96,706 | 1.3% |
[ 0.5% - 1.0% ] 0.67% | 15,838 | 2.5% |
[ 0.5% - 1.0% ] 0.69% | 116,386 | 2.8% |
[ 0.5% - 1.0% ] 0.71% | 67,444 | 3.7% |
[ 0.5% - 1.0% ] 0.73% | 56,556 | 1.5% |
[ 0.5% - 1.0% ] 0.75% | 110,916 | 2.8% |
[ 0.5% - 1.0% ] 0.79% | 18,067 | 1.3% |
[ 0.5% - 1.0% ] 0.81% | 53,660 | 2.5% |
[ 0.5% - 1.0% ] 0.84% | 31,999 | 3.1% |
[ 0.5% - 1.0% ] 0.93% | 38,053 | 2.4% |
[ 1.0% - 1.5% ] 1.01% | 67,945 | 2.8% |
[ 1.0% - 1.5% ] 1.02% | 33,252 | 0.95% |
[ 1.0% - 1.5% ] 1.12% | 30,917 | 3.0% |
[ 1.0% - 1.5% ] 1.25% | 10,527 | 4.0% |
[ 1.0% - 1.5% ] 1.29% | 40,243 | 4.9% |
[ 1.0% - 1.5% ] 1.35% | 18,613 | 2.8% |
[ 1.0% - 1.5% ] 1.45% | 2,204 | 1.4% |
[ 1.5% - 2.0% ] 1.52% | 13,873 | 3.5% |
[ 1.5% - 2.0% ] 1.57% | 19,069 | 1.5% |
[ 2.0% - 2.5% ] 2.10% | 1,525 | 5.1% |
[ 2.0% - 2.5% ] 2.11% | 9,415 | 1.4% |
[ 2.0% - 2.5% ] 2.15% | 5,708 | 1.5% |
[ 2.0% - 2.5% ] 2.49% | 1,366 | 5.3% |
[ 2.5% - 3.0% ] 2.60% | 9,873 | 0.74% |
[ 3.0% - 3.5% ] 3.30% | 3,575 | 2.4% |
[ 3.5% - 4.0% ] 3.66% | 3,365 | 2.1% |
[ 4.5% - 5.0% ] 4.83% | 4,890 | 1.7% |