Senegalese Unemployment Among Women with Children Ages 6 to 17 years

COMPARE

Senegalese
Race
Ancestry
AfghanAfricanAlaska NativeAlaskan AthabascanAlbanianAleutAlsatianAmericanApacheArabArapahoArgentineanArmenianAssyrian/Chaldean/SyriacAustralianAustrianBahamianBangladeshiBarbadianBasqueBelgianBelizeanBermudanBhutaneseBlackfeetBolivianBrazilianBritishBritish West IndianBulgarianBurmeseCajunCambodianCanadianCape VerdeanCarpatho RusynCelticCentral AmericanCentral American IndianCherokeeCheyenneChickasawChileanChineseChippewaChoctawColombianColvilleComancheCosta RicanCreeCreekCroatianCrowCubanCypriotCzechCzechoslovakianDanishDelawareDominicanDutchDutch West IndianEastern EuropeanEcuadorianEgyptianEnglishEstonianEthiopianEuropeanFijianFilipinoFinnishFrenchFrench American IndianFrench CanadianGermanGerman RussianGhanaianGreekGuamanian/ChamorroGuatemalanGuyaneseHaitianHmongHonduranHopiHoumaHungarianIcelanderIndian (Asian)IndonesianInupiatIranianIraqiIrishIroquoisIsraeliItalianJamaicanJapaneseJordanianKenyanKiowaKoreanLaotianLatvianLebaneseLiberianLithuanianLumbeeLuxembourgerMacedonianMalaysianMalteseMarshalleseMenomineeMexicanMexican American IndianMongolianMoroccanNative HawaiianNavajoNepaleseNew ZealanderNicaraguanNigerianNorthern EuropeanNorwegianOkinawanOsageOttawaPaiutePakistaniPalestinianPanamanianParaguayanPennsylvania GermanPeruvianPimaPolishPortuguesePotawatomiPuebloPuerto RicanPuget Sound SalishRomanianRussianSalvadoranSamoanScandinavianScotch-IrishScottishSeminoleSenegaleseSerbianShoshoneSierra LeoneanSiouxSlavicSlovakSloveneSomaliSouth AfricanSouth AmericanSouth American IndianSoviet UnionSpaniardSpanishSpanish AmericanSpanish American IndianSri LankanSubsaharan AfricanSudaneseSwedishSwissSyrianTaiwaneseThaiTlingit-HaidaTohono O'OdhamTonganTrinidadian and TobagonianTsimshianTurkishU.S. Virgin IslanderUgandanUkrainianUruguayanUteVenezuelanVietnameseWelshWest IndianYakamaYaquiYugoslavianYumanYup'ikZimbabwean
Immigration
NonimmigrantsImmigrantsAfghanistanAfricaAlbaniaArgentinaArmeniaAsiaAustraliaAustriaBahamasBangladeshBarbadosBelarusBelgiumBelizeBoliviaBosnia and HerzegovinaBrazilBulgariaBurma/MyanmarCabo VerdeCambodiaCameroonCanadaCaribbeanCentral AmericaChileChinaColombiaCongoCosta RicaCroatiaCubaCzechoslovakiaDenmarkDominicaDominican RepublicEastern AfricaEastern AsiaEastern EuropeEcuadorEgyptEl SalvadorEnglandEritreaEthiopiaEuropeFijiFranceGermanyGhanaGreeceGrenadaGuatemalaGuyanaHaitiHondurasHong KongHungaryIndiaIndonesiaIranIraqIrelandIsraelItalyJamaicaJapanJordanKazakhstanKenyaKoreaKuwaitLaosLatin AmericaLatviaLebanonLiberiaLithuaniaMalaysiaMexicoMicronesiaMiddle AfricaMoldovaMoroccoNepalNetherlandsNicaraguaNigeriaNorth AmericaNorth MacedoniaNorthern AfricaNorthern EuropeNorwayOceaniaPakistanPanamaPeruPhilippinesPolandPortugalRomaniaRussiaSaudi ArabiaScotlandSenegalSerbiaSierra LeoneSingaporeSomaliaSouth AfricaSouth AmericaSouth Central AsiaSouth Eastern AsiaSouthern EuropeSpainSri LankaSt. Vincent and the GrenadinesSudanSwedenSwitzerlandSyriaTaiwanThailandTrinidad and TobagoTurkeyUgandaUkraineUruguayUzbekistanVenezuelaVietnamWest IndiesWestern AfricaWestern AsiaWestern EuropeYemenZaireZimbabweAzores
Select to Compare
Race
Ancestry
AfghanAfricanAlaska NativeAlaskan AthabascanAlbanianAleutAlsatianAmericanApacheArabArapahoArgentineanArmenianAssyrian/Chaldean/SyriacAustralianAustrianBahamianBangladeshiBarbadianBasqueBelgianBelizeanBermudanBhutaneseBlackfeetBolivianBrazilianBritishBritish West IndianBulgarianBurmeseCajunCambodianCanadianCape VerdeanCarpatho RusynCelticCentral AmericanCentral American IndianCherokeeCheyenneChickasawChileanChineseChippewaChoctawColombianColvilleComancheCosta RicanCreeCreekCroatianCrowCubanCypriotCzechCzechoslovakianDanishDelawareDominicanDutchDutch West IndianEastern EuropeanEcuadorianEgyptianEnglishEstonianEthiopianEuropeanFijianFilipinoFinnishFrenchFrench American IndianFrench CanadianGermanGerman RussianGhanaianGreekGuamanian/ChamorroGuatemalanGuyaneseHaitianHmongHonduranHopiHoumaHungarianIcelanderIndian (Asian)IndonesianInupiatIranianIraqiIrishIroquoisIsraeliItalianJamaicanJapaneseJordanianKenyanKiowaKoreanLaotianLatvianLebaneseLiberianLithuanianLumbeeLuxembourgerMacedonianMalaysianMalteseMarshalleseMenomineeMexicanMexican American IndianMongolianMoroccanNative HawaiianNavajoNepaleseNew ZealanderNicaraguanNigerianNorthern EuropeanNorwegianOkinawanOsageOttawaPaiutePakistaniPalestinianPanamanianParaguayanPennsylvania GermanPeruvianPimaPolishPortuguesePotawatomiPuebloPuerto RicanPuget Sound SalishRomanianRussianSalvadoranSamoanScandinavianScotch-IrishScottishSeminoleSerbianShoshoneSierra LeoneanSiouxSlavicSlovakSloveneSomaliSouth AfricanSouth AmericanSouth American IndianSoviet UnionSpaniardSpanishSpanish AmericanSpanish American IndianSri LankanSubsaharan AfricanSudaneseSwedishSwissSyrianTaiwaneseThaiTlingit-HaidaTohono O'OdhamTonganTrinidadian and TobagonianTsimshianTurkishU.S. Virgin IslanderUgandanUkrainianUruguayanUteVenezuelanVietnameseWelshWest IndianYakamaYaquiYugoslavianYumanYup'ikZimbabwean
Immigration
NonimmigrantsImmigrantsAfghanistanAfricaAlbaniaArgentinaArmeniaAsiaAustraliaAustriaBahamasBangladeshBarbadosBelarusBelgiumBelizeBoliviaBosnia and HerzegovinaBrazilBulgariaBurma/MyanmarCabo VerdeCambodiaCameroonCanadaCaribbeanCentral AmericaChileChinaColombiaCongoCosta RicaCroatiaCubaCzechoslovakiaDenmarkDominicaDominican RepublicEastern AfricaEastern AsiaEastern EuropeEcuadorEgyptEl SalvadorEnglandEritreaEthiopiaEuropeFijiFranceGermanyGhanaGreeceGrenadaGuatemalaGuyanaHaitiHondurasHong KongHungaryIndiaIndonesiaIranIraqIrelandIsraelItalyJamaicaJapanJordanKazakhstanKenyaKoreaKuwaitLaosLatin AmericaLatviaLebanonLiberiaLithuaniaMalaysiaMexicoMicronesiaMiddle AfricaMoldovaMoroccoNepalNetherlandsNicaraguaNigeriaNorth AmericaNorth MacedoniaNorthern AfricaNorthern EuropeNorwayOceaniaPakistanPanamaPeruPhilippinesPolandPortugalRomaniaRussiaSaudi ArabiaScotlandSenegalSerbiaSierra LeoneSingaporeSomaliaSouth AfricaSouth AmericaSouth Central AsiaSouth Eastern AsiaSouthern EuropeSpainSri LankaSt. Vincent and the GrenadinesSudanSwedenSwitzerlandSyriaTaiwanThailandTrinidad and TobagoTurkeyUgandaUkraineUruguayUzbekistanVenezuelaVietnamWest IndiesWestern AfricaWestern AsiaWestern EuropeYemenZaireZimbabweAzores
Unemployment Among Women with Children Ages 6 to 17 years
Income
Poverty
Unemployment
Labor Participation
Family Structure
Vehicle Availability
Education Level
Disability

Senegalese Unemployment Among Women with Children Ages 6 to 17 years
Tragic

9.5%
UNEMPLOYMENT | WOMEN W/ CHILDREN 6 TO 17
0.5/ 100
METRIC RATING
262nd/ 347
METRIC RANK

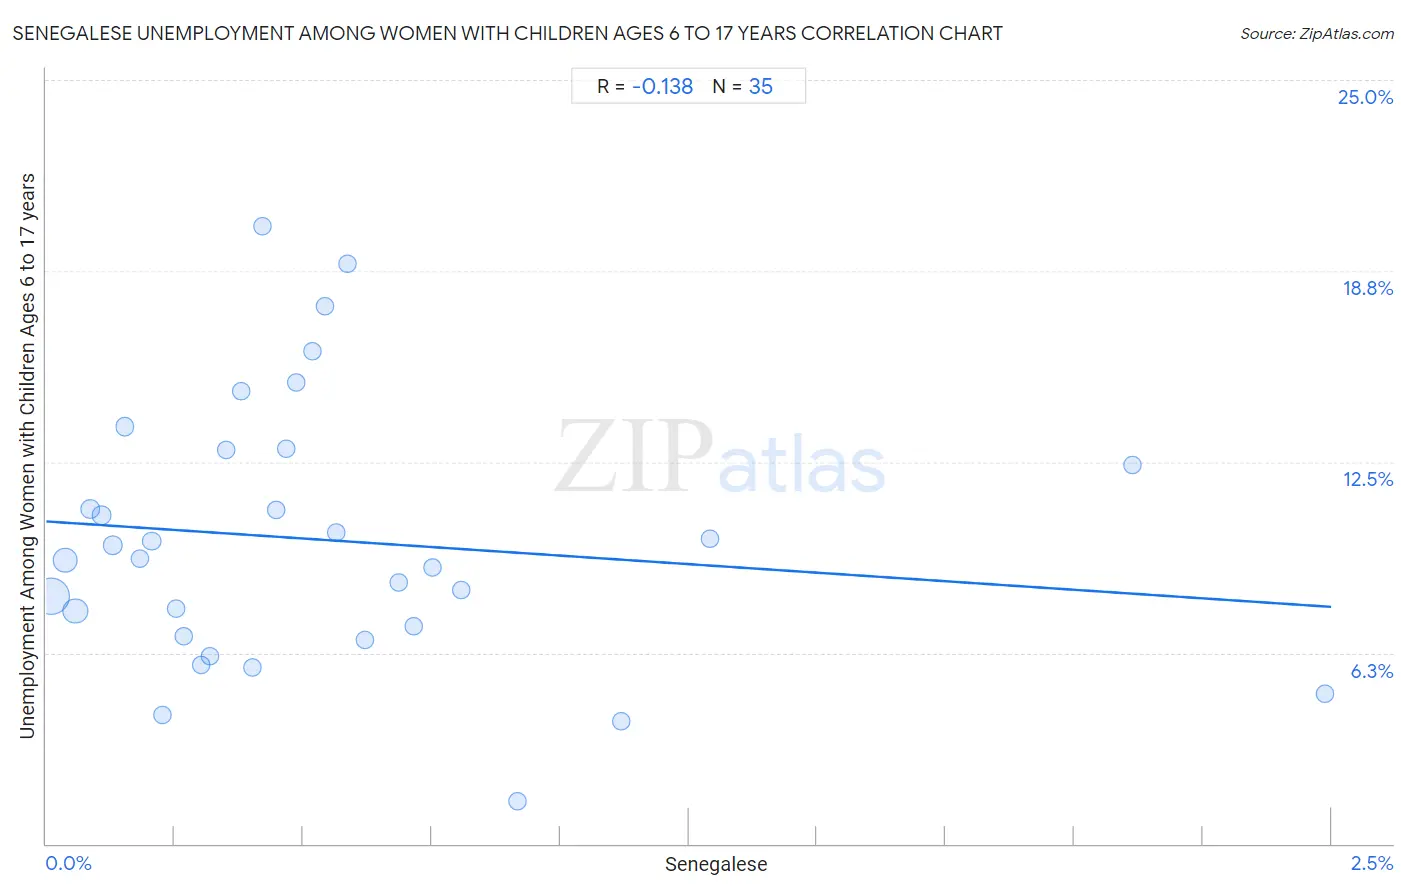
Senegalese Unemployment Among Women with Children Ages 6 to 17 years Correlation Chart

The statistical analysis conducted on geographies consisting of 70,256,082 people shows a poor negative correlation between the proportion of Senegalese and unemployment rate among women with children between the ages 6 and 17 in the United States with a correlation coefficient (R) of -0.138 and weighted average of 9.5%. On average, for every 1% (one percent) increase in Senegalese within a typical geography, there is a decrease of 1.1% in unemployment rate among women with children between the ages 6 and 17.
Senegalese Unemployment Among Women with Children Ages 6 to 17 years
It is essential to understand that the correlation between the percentage of Senegalese and unemployment rate among women with children between the ages 6 and 17 does not imply a direct cause-and-effect relationship. It remains uncertain whether the presence of Senegalese influences an upward or downward trend in the level of unemployment rate among women with children between the ages 6 and 17 within an area, or if Senegalese simply ended up residing in those areas with higher or lower levels of unemployment rate among women with children between the ages 6 and 17 due to other factors.

Demographics Similar to Senegalese by Unemployment Among Women with Children Ages 6 to 17 years

In terms of unemployment among women with children ages 6 to 17 years, the demographic groups most similar to Senegalese are Lebanese (9.5%, a difference of 0.040%), South American (9.5%, a difference of 0.050%), Italian (9.5%, a difference of 0.14%), Immigrants from Central America (9.5%, a difference of 0.25%), and Immigrants from Ghana (9.5%, a difference of 0.28%).
DemographicsRating | RankUnemployment Among Women with Children Ages 6 to 17 years
Lithuanians
0.9
/100
|
#255
Tragic
9.4%
Canadians
0.8
/100
|
#256
Tragic
9.4%
Celtics
0.7
/100
|
#257
Tragic
9.5%
Immigrants from Mexico
0.7
/100
|
#258
Tragic
9.5%
Immigrants from Central America
0.6
/100
|
#259
Tragic
9.5%
Italians
0.6
/100
|
#260
Tragic
9.5%
South Americans
0.5
/100
|
#261
Tragic
9.5%
Senegalese
0.5
/100
|
#262
Tragic
9.5%
Lebanese
0.5
/100
|
#263
Tragic
9.5%
Immigrants from Ghana
0.4
/100
|
#264
Tragic
9.5%
West Indians
0.4
/100
|
#265
Tragic
9.5%
Immigrants from Jamaica
0.3
/100
|
#266
Tragic
9.5%
Irish
0.3
/100
|
#267
Tragic
9.5%
Ghanaians
0.2
/100
|
#268
Tragic
9.6%
Blackfeet
0.2
/100
|
#269
Tragic
9.6%

Senegalese Unemployment Among Women with Children Ages 6 to 17 years Correlation Summary

MeasurementSenegalese DataUnemployment Among Women with Children Ages 6 to 17 years Data
Minimum0.0091%1.4%
Maximum2.5%20.2%
Range2.5%18.8%
Mean0.54%9.9%
Median0.42%9.3%
Interquartile 25% (IQ1)0.21%6.8%
Interquartile 75% (IQ3)0.68%12.9%
Interquartile Range (IQR)0.48%6.1%
Standard Deviation (Sample)0.53%4.3%
Standard Deviation (Population)0.53%4.3%

Correlation Details

Senegalese PercentileSample SizeUnemployment Among Women with Children Ages 6 to 17 years
[
0.0%
-
0.5%
]
0.0091%
36,476,9358.1%
[
0.0%
-
0.5%
]
0.036%
11,390,2889.3%
[
0.0%
-
0.5%
]
0.056%
13,109,9247.6%
[
0.0%
-
0.5%
]
0.086%
1,399,85811.0%
[
0.0%
-
0.5%
]
0.11%
1,224,99110.7%
[
0.0%
-
0.5%
]
0.13%
1,381,9719.8%
[
0.0%
-
0.5%
]
0.15%
871,17513.7%
[
0.0%
-
0.5%
]
0.18%
396,7579.3%
[
0.0%
-
0.5%
]
0.21%
536,8379.9%
[
0.0%
-
0.5%
]
0.23%
116,7854.2%
[
0.0%
-
0.5%
]
0.25%
533,6117.7%
[
0.0%
-
0.5%
]
0.27%
58,2986.8%
[
0.0%
-
0.5%
]
0.30%
254,6815.9%
[
0.0%
-
0.5%
]
0.32%
183,6686.1%
[
0.0%
-
0.5%
]
0.35%
241,36512.9%
[
0.0%
-
0.5%
]
0.38%
176,94714.8%
[
0.0%
-
0.5%
]
0.40%
252,0525.8%
[
0.0%
-
0.5%
]
0.42%
186,68720.2%
[
0.0%
-
0.5%
]
0.45%
249,92310.9%
[
0.0%
-
0.5%
]
0.47%
109,31812.9%
[
0.0%
-
0.5%
]
0.49%
48,82315.1%
[
0.5%
-
1.0%
]
0.52%
177,76516.1%
[
0.5%
-
1.0%
]
0.54%
125,23917.6%
[
0.5%
-
1.0%
]
0.56%
40,96610.2%
[
0.5%
-
1.0%
]
0.59%
24,38019.0%
[
0.5%
-
1.0%
]
0.62%
296,9476.7%
[
0.5%
-
1.0%
]
0.68%
100,4468.6%
[
0.5%
-
1.0%
]
0.71%
66,1747.1%
[
0.5%
-
1.0%
]
0.75%
106,8479.0%
[
0.5%
-
1.0%
]
0.81%
22,6448.3%
[
0.5%
-
1.0%
]
0.92%
20,8141.4%
[
1.0%
-
1.5%
]
1.12%
30,9174.0%
[
1.0%
-
1.5%
]
1.29%
31,26810.0%
[
2.0%
-
2.5%
]
2.11%
9,41512.4%
[
2.0%
-
2.5%
]
2.49%
1,3664.9%