Senegalese Married-Couple Family Poverty

COMPARE

Senegalese
Race
Ancestry
AfghanAfricanAlaska NativeAlaskan AthabascanAlbanianAleutAlsatianAmericanApacheArabArapahoArgentineanArmenianAssyrian/Chaldean/SyriacAustralianAustrianBahamianBangladeshiBarbadianBasqueBelgianBelizeanBermudanBhutaneseBlackfeetBolivianBrazilianBritishBritish West IndianBulgarianBurmeseCajunCambodianCanadianCape VerdeanCarpatho RusynCelticCentral AmericanCentral American IndianCherokeeCheyenneChickasawChileanChineseChippewaChoctawColombianColvilleComancheCosta RicanCreeCreekCroatianCrowCubanCypriotCzechCzechoslovakianDanishDelawareDominicanDutchDutch West IndianEastern EuropeanEcuadorianEgyptianEnglishEstonianEthiopianEuropeanFijianFilipinoFinnishFrenchFrench American IndianFrench CanadianGermanGerman RussianGhanaianGreekGuamanian/ChamorroGuatemalanGuyaneseHaitianHmongHonduranHopiHoumaHungarianIcelanderIndian (Asian)IndonesianInupiatIranianIraqiIrishIroquoisIsraeliItalianJamaicanJapaneseJordanianKenyanKiowaKoreanLaotianLatvianLebaneseLiberianLithuanianLumbeeLuxembourgerMacedonianMalaysianMalteseMarshalleseMenomineeMexicanMexican American IndianMongolianMoroccanNative HawaiianNavajoNepaleseNew ZealanderNicaraguanNigerianNorthern EuropeanNorwegianOkinawanOsageOttawaPaiutePakistaniPalestinianPanamanianParaguayanPennsylvania GermanPeruvianPimaPolishPortuguesePotawatomiPuebloPuerto RicanPuget Sound SalishRomanianRussianSalvadoranSamoanScandinavianScotch-IrishScottishSeminoleSenegaleseSerbianShoshoneSierra LeoneanSiouxSlavicSlovakSloveneSomaliSouth AfricanSouth AmericanSouth American IndianSoviet UnionSpaniardSpanishSpanish AmericanSpanish American IndianSri LankanSubsaharan AfricanSudaneseSwedishSwissSyrianTaiwaneseThaiTlingit-HaidaTohono O'OdhamTonganTrinidadian and TobagonianTsimshianTurkishU.S. Virgin IslanderUgandanUkrainianUruguayanUteVenezuelanVietnameseWelshWest IndianYakamaYaquiYugoslavianYumanYup'ikZimbabwean
Immigration
NonimmigrantsImmigrantsAfghanistanAfricaAlbaniaArgentinaArmeniaAsiaAustraliaAustriaBahamasBangladeshBarbadosBelarusBelgiumBelizeBoliviaBosnia and HerzegovinaBrazilBulgariaBurma/MyanmarCabo VerdeCambodiaCameroonCanadaCaribbeanCentral AmericaChileChinaColombiaCongoCosta RicaCroatiaCubaCzechoslovakiaDenmarkDominicaDominican RepublicEastern AfricaEastern AsiaEastern EuropeEcuadorEgyptEl SalvadorEnglandEritreaEthiopiaEuropeFijiFranceGermanyGhanaGreeceGrenadaGuatemalaGuyanaHaitiHondurasHong KongHungaryIndiaIndonesiaIranIraqIrelandIsraelItalyJamaicaJapanJordanKazakhstanKenyaKoreaKuwaitLaosLatin AmericaLatviaLebanonLiberiaLithuaniaMalaysiaMexicoMicronesiaMiddle AfricaMoldovaMoroccoNepalNetherlandsNicaraguaNigeriaNorth AmericaNorth MacedoniaNorthern AfricaNorthern EuropeNorwayOceaniaPakistanPanamaPeruPhilippinesPolandPortugalRomaniaRussiaSaudi ArabiaScotlandSenegalSerbiaSierra LeoneSingaporeSomaliaSouth AfricaSouth AmericaSouth Central AsiaSouth Eastern AsiaSouthern EuropeSpainSri LankaSt. Vincent and the GrenadinesSudanSwedenSwitzerlandSyriaTaiwanThailandTrinidad and TobagoTurkeyUgandaUkraineUruguayUzbekistanVenezuelaVietnamWest IndiesWestern AfricaWestern AsiaWestern EuropeYemenZaireZimbabweAzores
Select to Compare
Race
Ancestry
AfghanAfricanAlaska NativeAlaskan AthabascanAlbanianAleutAlsatianAmericanApacheArabArapahoArgentineanArmenianAssyrian/Chaldean/SyriacAustralianAustrianBahamianBangladeshiBarbadianBasqueBelgianBelizeanBermudanBhutaneseBlackfeetBolivianBrazilianBritishBritish West IndianBulgarianBurmeseCajunCambodianCanadianCape VerdeanCarpatho RusynCelticCentral AmericanCentral American IndianCherokeeCheyenneChickasawChileanChineseChippewaChoctawColombianColvilleComancheCosta RicanCreeCreekCroatianCrowCubanCypriotCzechCzechoslovakianDanishDelawareDominicanDutchDutch West IndianEastern EuropeanEcuadorianEgyptianEnglishEstonianEthiopianEuropeanFijianFilipinoFinnishFrenchFrench American IndianFrench CanadianGermanGerman RussianGhanaianGreekGuamanian/ChamorroGuatemalanGuyaneseHaitianHmongHonduranHopiHoumaHungarianIcelanderIndian (Asian)IndonesianInupiatIranianIraqiIrishIroquoisIsraeliItalianJamaicanJapaneseJordanianKenyanKiowaKoreanLaotianLatvianLebaneseLiberianLithuanianLumbeeLuxembourgerMacedonianMalaysianMalteseMarshalleseMenomineeMexicanMexican American IndianMongolianMoroccanNative HawaiianNavajoNepaleseNew ZealanderNicaraguanNigerianNorthern EuropeanNorwegianOkinawanOsageOttawaPaiutePakistaniPalestinianPanamanianParaguayanPennsylvania GermanPeruvianPimaPolishPortuguesePotawatomiPuebloPuerto RicanPuget Sound SalishRomanianRussianSalvadoranSamoanScandinavianScotch-IrishScottishSeminoleSerbianShoshoneSierra LeoneanSiouxSlavicSlovakSloveneSomaliSouth AfricanSouth AmericanSouth American IndianSoviet UnionSpaniardSpanishSpanish AmericanSpanish American IndianSri LankanSubsaharan AfricanSudaneseSwedishSwissSyrianTaiwaneseThaiTlingit-HaidaTohono O'OdhamTonganTrinidadian and TobagonianTsimshianTurkishU.S. Virgin IslanderUgandanUkrainianUruguayanUteVenezuelanVietnameseWelshWest IndianYakamaYaquiYugoslavianYumanYup'ikZimbabwean
Immigration
NonimmigrantsImmigrantsAfghanistanAfricaAlbaniaArgentinaArmeniaAsiaAustraliaAustriaBahamasBangladeshBarbadosBelarusBelgiumBelizeBoliviaBosnia and HerzegovinaBrazilBulgariaBurma/MyanmarCabo VerdeCambodiaCameroonCanadaCaribbeanCentral AmericaChileChinaColombiaCongoCosta RicaCroatiaCubaCzechoslovakiaDenmarkDominicaDominican RepublicEastern AfricaEastern AsiaEastern EuropeEcuadorEgyptEl SalvadorEnglandEritreaEthiopiaEuropeFijiFranceGermanyGhanaGreeceGrenadaGuatemalaGuyanaHaitiHondurasHong KongHungaryIndiaIndonesiaIranIraqIrelandIsraelItalyJamaicaJapanJordanKazakhstanKenyaKoreaKuwaitLaosLatin AmericaLatviaLebanonLiberiaLithuaniaMalaysiaMexicoMicronesiaMiddle AfricaMoldovaMoroccoNepalNetherlandsNicaraguaNigeriaNorth AmericaNorth MacedoniaNorthern AfricaNorthern EuropeNorwayOceaniaPakistanPanamaPeruPhilippinesPolandPortugalRomaniaRussiaSaudi ArabiaScotlandSenegalSerbiaSierra LeoneSingaporeSomaliaSouth AfricaSouth AmericaSouth Central AsiaSouth Eastern AsiaSouthern EuropeSpainSri LankaSt. Vincent and the GrenadinesSudanSwedenSwitzerlandSyriaTaiwanThailandTrinidad and TobagoTurkeyUgandaUkraineUruguayUzbekistanVenezuelaVietnamWest IndiesWestern AfricaWestern AsiaWestern EuropeYemenZaireZimbabweAzores
Married-Couple Family Poverty
Income
Poverty
Unemployment
Labor Participation
Family Structure
Vehicle Availability
Education Level
Disability

Senegalese Married-Couple Family Poverty
Tragic

6.1%
POVERTY | MARRIED-COUPLE FAMILIES
0.3/ 100
METRIC RATING
261st/ 347
METRIC RANK

Senegalese Married-Couple Family Poverty Correlation Chart

The statistical analysis conducted on geographies consisting of 78,006,909 people shows a poor negative correlation between the proportion of Senegalese and poverty level among married-couple families in the United States with a correlation coefficient (R) of -0.187 and weighted average of 6.1%. On average, for every 1% (one percent) increase in Senegalese within a typical geography, there is a decrease of 0.53% in poverty level among married-couple families.
Senegalese Married-Couple Family Poverty
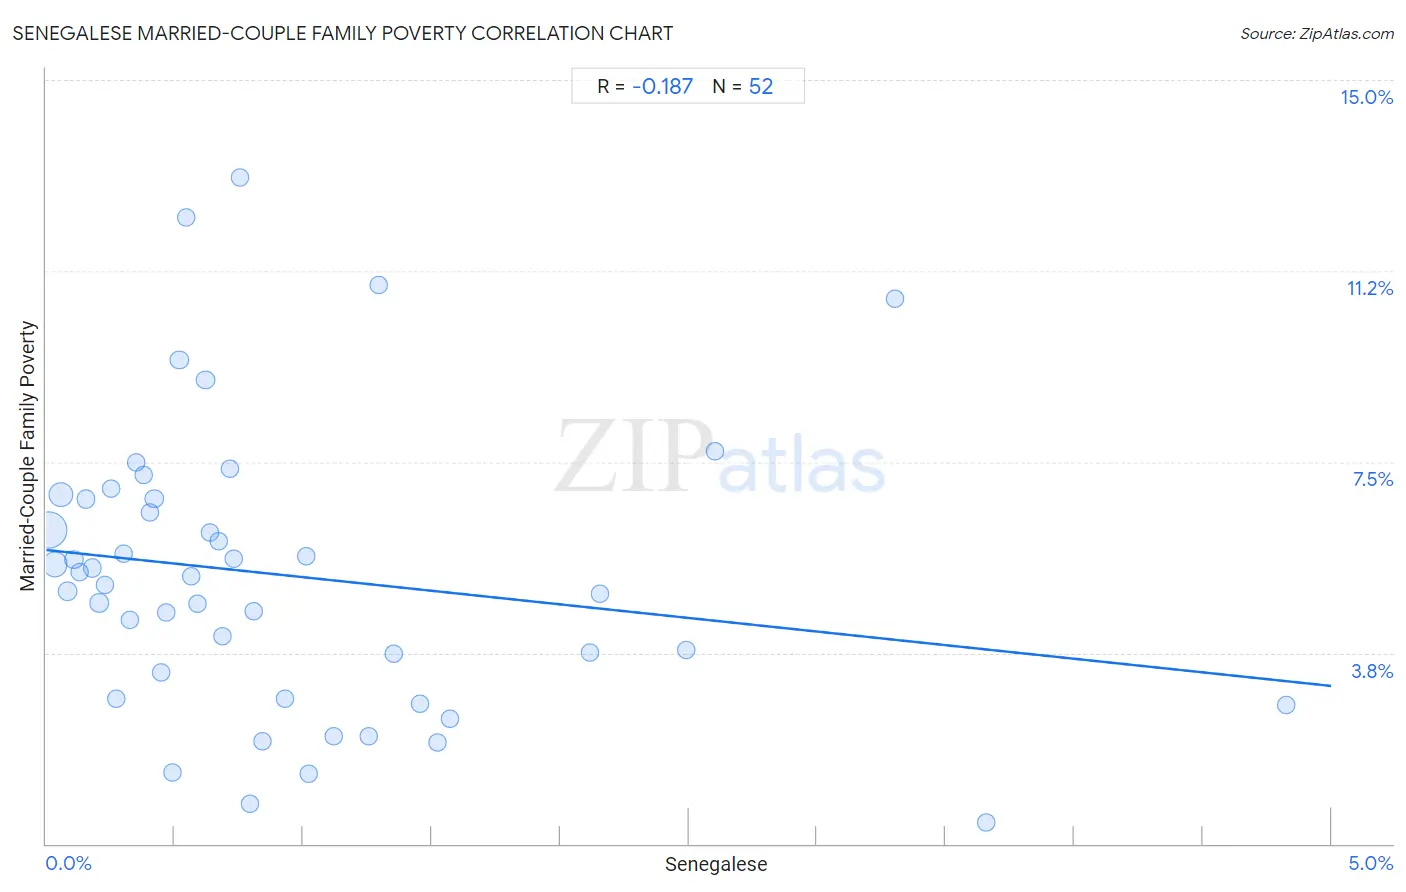
It is essential to understand that the correlation between the percentage of Senegalese and poverty level among married-couple families does not imply a direct cause-and-effect relationship. It remains uncertain whether the presence of Senegalese influences an upward or downward trend in the level of poverty level among married-couple families within an area, or if Senegalese simply ended up residing in those areas with higher or lower levels of poverty level among married-couple families due to other factors.

Demographics Similar to Senegalese by Married-Couple Family Poverty

In terms of married-couple family poverty, the demographic groups most similar to Senegalese are Jamaican (6.1%, a difference of 0.19%), Shoshone (6.1%, a difference of 0.21%), Alaskan Athabascan (6.1%, a difference of 0.40%), Immigrants from Senegal (6.1%, a difference of 0.60%), and Immigrants from Congo (6.1%, a difference of 0.83%).
DemographicsRating | RankMarried-Couple Family Poverty
Immigrants from Somalia
0.7
/100
|
#254
Tragic
6.0%
Comanche
0.7
/100
|
#255
Tragic
6.0%
Bangladeshis
0.5
/100
|
#256
Tragic
6.0%
Immigrants from Burma/Myanmar
0.5
/100
|
#257
Tragic
6.0%
Immigrants
0.5
/100
|
#258
Tragic
6.0%
Alaskan Athabascans
0.4
/100
|
#259
Tragic
6.1%
Jamaicans
0.3
/100
|
#260
Tragic
6.1%
Senegalese
0.3
/100
|
#261
Tragic
6.1%
Shoshone
0.3
/100
|
#262
Tragic
6.1%
Immigrants from Senegal
0.3
/100
|
#263
Tragic
6.1%
Immigrants from Congo
0.2
/100
|
#264
Tragic
6.1%
Blackfeet
0.2
/100
|
#265
Tragic
6.2%
Creek
0.2
/100
|
#266
Tragic
6.2%
Spanish Americans
0.2
/100
|
#267
Tragic
6.2%
Alaska Natives
0.2
/100
|
#268
Tragic
6.2%

Senegalese Married-Couple Family Poverty Correlation Summary

MeasurementSenegalese DataMarried-Couple Family Poverty Data
Minimum0.0093%0.42%
Maximum4.8%13.1%
Range4.8%12.7%
Mean0.93%5.3%
Median0.63%5.2%
Interquartile 25% (IQ1)0.31%3.1%
Interquartile 75% (IQ3)1.2%6.8%
Interquartile Range (IQR)0.87%3.7%
Standard Deviation (Sample)0.98%2.8%
Standard Deviation (Population)0.97%2.8%

Correlation Details

Senegalese PercentileSample SizeMarried-Couple Family Poverty
[
0.0%
-
0.5%
]
0.0093%
37,948,7126.2%
[
0.0%
-
0.5%
]
0.036%
12,832,5545.5%
[
0.0%
-
0.5%
]
0.057%
14,084,6616.9%
[
0.0%
-
0.5%
]
0.085%
2,410,3555.0%
[
0.0%
-
0.5%
]
0.11%
1,639,4105.6%
[
0.0%
-
0.5%
]
0.13%
1,618,4235.3%
[
0.0%
-
0.5%
]
0.15%
1,151,9296.8%
[
0.0%
-
0.5%
]
0.18%
590,6365.4%
[
0.0%
-
0.5%
]
0.21%
746,9434.7%
[
0.0%
-
0.5%
]
0.23%
268,8585.1%
[
0.0%
-
0.5%
]
0.25%
544,6817.0%
[
0.0%
-
0.5%
]
0.27%
111,1012.9%
[
0.0%
-
0.5%
]
0.30%
346,6525.7%
[
0.0%
-
0.5%
]
0.33%
403,4554.4%
[
0.0%
-
0.5%
]
0.35%
294,6077.5%
[
0.0%
-
0.5%
]
0.38%
202,1707.2%
[
0.0%
-
0.5%
]
0.40%
353,1136.5%
[
0.0%
-
0.5%
]
0.42%
286,6196.8%
[
0.0%
-
0.5%
]
0.45%
363,3593.4%
[
0.0%
-
0.5%
]
0.47%
122,2354.5%
[
0.0%
-
0.5%
]
0.49%
81,2331.4%
[
0.5%
-
1.0%
]
0.52%
217,8239.5%
[
0.5%
-
1.0%
]
0.54%
129,74212.3%
[
0.5%
-
1.0%
]
0.56%
51,2825.3%
[
0.5%
-
1.0%
]
0.59%
24,3804.7%
[
0.5%
-
1.0%
]
0.62%
307,7409.1%
[
0.5%
-
1.0%
]
0.64%
96,7066.1%
[
0.5%
-
1.0%
]
0.67%
14,9335.9%
[
0.5%
-
1.0%
]
0.69%
116,3864.1%
[
0.5%
-
1.0%
]
0.71%
67,4447.4%
[
0.5%
-
1.0%
]
0.73%
56,5565.6%
[
0.5%
-
1.0%
]
0.75%
106,84713.1%
[
0.5%
-
1.0%
]
0.79%
18,0670.78%
[
0.5%
-
1.0%
]
0.81%
52,4104.6%
[
0.5%
-
1.0%
]
0.84%
31,9992.0%
[
0.5%
-
1.0%
]
0.93%
38,0532.8%
[
1.0%
-
1.5%
]
1.01%
67,9455.7%
[
1.0%
-
1.5%
]
1.02%
33,2521.4%
[
1.0%
-
1.5%
]
1.12%
30,9172.1%
[
1.0%
-
1.5%
]
1.25%
10,5272.1%
[
1.0%
-
1.5%
]
1.29%
40,24311.0%
[
1.0%
-
1.5%
]
1.35%
18,6133.7%
[
1.0%
-
1.5%
]
1.45%
2,2042.8%
[
1.5%
-
2.0%
]
1.52%
13,8732.0%
[
1.5%
-
2.0%
]
1.57%
19,0692.5%
[
2.0%
-
2.5%
]
2.11%
9,4153.7%
[
2.0%
-
2.5%
]
2.15%
5,7084.9%
[
2.0%
-
2.5%
]
2.49%
1,3663.8%
[
2.5%
-
3.0%
]
2.60%
9,8737.7%
[
3.0%
-
3.5%
]
3.30%
3,57510.7%
[
3.5%
-
4.0%
]
3.66%
3,3650.42%
[
4.5%
-
5.0%
]
4.83%
4,8902.7%