Senegalese 1 or more Vehicles in Household

COMPARE

Senegalese
Race
Ancestry
AfghanAfricanAlaska NativeAlaskan AthabascanAlbanianAleutAlsatianAmericanApacheArabArapahoArgentineanArmenianAssyrian/Chaldean/SyriacAustralianAustrianBahamianBangladeshiBarbadianBasqueBelgianBelizeanBermudanBhutaneseBlackfeetBolivianBrazilianBritishBritish West IndianBulgarianBurmeseCajunCambodianCanadianCape VerdeanCarpatho RusynCelticCentral AmericanCentral American IndianCherokeeCheyenneChickasawChileanChineseChippewaChoctawColombianColvilleComancheCosta RicanCreeCreekCroatianCrowCubanCypriotCzechCzechoslovakianDanishDelawareDominicanDutchDutch West IndianEastern EuropeanEcuadorianEgyptianEnglishEstonianEthiopianEuropeanFijianFilipinoFinnishFrenchFrench American IndianFrench CanadianGermanGerman RussianGhanaianGreekGuamanian/ChamorroGuatemalanGuyaneseHaitianHmongHonduranHopiHoumaHungarianIcelanderIndian (Asian)IndonesianInupiatIranianIraqiIrishIroquoisIsraeliItalianJamaicanJapaneseJordanianKenyanKiowaKoreanLaotianLatvianLebaneseLiberianLithuanianLumbeeLuxembourgerMacedonianMalaysianMalteseMarshalleseMenomineeMexicanMexican American IndianMongolianMoroccanNative HawaiianNavajoNepaleseNew ZealanderNicaraguanNigerianNorthern EuropeanNorwegianOkinawanOsageOttawaPaiutePakistaniPalestinianPanamanianParaguayanPennsylvania GermanPeruvianPimaPolishPortuguesePotawatomiPuebloPuerto RicanPuget Sound SalishRomanianRussianSalvadoranSamoanScandinavianScotch-IrishScottishSeminoleSenegaleseSerbianShoshoneSierra LeoneanSiouxSlavicSlovakSloveneSomaliSouth AfricanSouth AmericanSouth American IndianSoviet UnionSpaniardSpanishSpanish AmericanSpanish American IndianSri LankanSubsaharan AfricanSudaneseSwedishSwissSyrianTaiwaneseThaiTlingit-HaidaTohono O'OdhamTonganTrinidadian and TobagonianTsimshianTurkishU.S. Virgin IslanderUgandanUkrainianUruguayanUteVenezuelanVietnameseWelshWest IndianYakamaYaquiYugoslavianYumanYup'ikZimbabwean
Immigration
NonimmigrantsImmigrantsAfghanistanAfricaAlbaniaArgentinaArmeniaAsiaAustraliaAustriaBahamasBangladeshBarbadosBelarusBelgiumBelizeBoliviaBosnia and HerzegovinaBrazilBulgariaBurma/MyanmarCabo VerdeCambodiaCameroonCanadaCaribbeanCentral AmericaChileChinaColombiaCongoCosta RicaCroatiaCubaCzechoslovakiaDenmarkDominicaDominican RepublicEastern AfricaEastern AsiaEastern EuropeEcuadorEgyptEl SalvadorEnglandEritreaEthiopiaEuropeFijiFranceGermanyGhanaGreeceGrenadaGuatemalaGuyanaHaitiHondurasHong KongHungaryIndiaIndonesiaIranIraqIrelandIsraelItalyJamaicaJapanJordanKazakhstanKenyaKoreaKuwaitLaosLatin AmericaLatviaLebanonLiberiaLithuaniaMalaysiaMexicoMicronesiaMiddle AfricaMoldovaMoroccoNepalNetherlandsNicaraguaNigeriaNorth AmericaNorth MacedoniaNorthern AfricaNorthern EuropeNorwayOceaniaPakistanPanamaPeruPhilippinesPolandPortugalRomaniaRussiaSaudi ArabiaScotlandSenegalSerbiaSierra LeoneSingaporeSomaliaSouth AfricaSouth AmericaSouth Central AsiaSouth Eastern AsiaSouthern EuropeSpainSri LankaSt. Vincent and the GrenadinesSudanSwedenSwitzerlandSyriaTaiwanThailandTrinidad and TobagoTurkeyUgandaUkraineUruguayUzbekistanVenezuelaVietnamWest IndiesWestern AfricaWestern AsiaWestern EuropeYemenZaireZimbabweAzores
Select to Compare
Race
Ancestry
AfghanAfricanAlaska NativeAlaskan AthabascanAlbanianAleutAlsatianAmericanApacheArabArapahoArgentineanArmenianAssyrian/Chaldean/SyriacAustralianAustrianBahamianBangladeshiBarbadianBasqueBelgianBelizeanBermudanBhutaneseBlackfeetBolivianBrazilianBritishBritish West IndianBulgarianBurmeseCajunCambodianCanadianCape VerdeanCarpatho RusynCelticCentral AmericanCentral American IndianCherokeeCheyenneChickasawChileanChineseChippewaChoctawColombianColvilleComancheCosta RicanCreeCreekCroatianCrowCubanCypriotCzechCzechoslovakianDanishDelawareDominicanDutchDutch West IndianEastern EuropeanEcuadorianEgyptianEnglishEstonianEthiopianEuropeanFijianFilipinoFinnishFrenchFrench American IndianFrench CanadianGermanGerman RussianGhanaianGreekGuamanian/ChamorroGuatemalanGuyaneseHaitianHmongHonduranHopiHoumaHungarianIcelanderIndian (Asian)IndonesianInupiatIranianIraqiIrishIroquoisIsraeliItalianJamaicanJapaneseJordanianKenyanKiowaKoreanLaotianLatvianLebaneseLiberianLithuanianLumbeeLuxembourgerMacedonianMalaysianMalteseMarshalleseMenomineeMexicanMexican American IndianMongolianMoroccanNative HawaiianNavajoNepaleseNew ZealanderNicaraguanNigerianNorthern EuropeanNorwegianOkinawanOsageOttawaPaiutePakistaniPalestinianPanamanianParaguayanPennsylvania GermanPeruvianPimaPolishPortuguesePotawatomiPuebloPuerto RicanPuget Sound SalishRomanianRussianSalvadoranSamoanScandinavianScotch-IrishScottishSeminoleSerbianShoshoneSierra LeoneanSiouxSlavicSlovakSloveneSomaliSouth AfricanSouth AmericanSouth American IndianSoviet UnionSpaniardSpanishSpanish AmericanSpanish American IndianSri LankanSubsaharan AfricanSudaneseSwedishSwissSyrianTaiwaneseThaiTlingit-HaidaTohono O'OdhamTonganTrinidadian and TobagonianTsimshianTurkishU.S. Virgin IslanderUgandanUkrainianUruguayanUteVenezuelanVietnameseWelshWest IndianYakamaYaquiYugoslavianYumanYup'ikZimbabwean
Immigration
NonimmigrantsImmigrantsAfghanistanAfricaAlbaniaArgentinaArmeniaAsiaAustraliaAustriaBahamasBangladeshBarbadosBelarusBelgiumBelizeBoliviaBosnia and HerzegovinaBrazilBulgariaBurma/MyanmarCabo VerdeCambodiaCameroonCanadaCaribbeanCentral AmericaChileChinaColombiaCongoCosta RicaCroatiaCubaCzechoslovakiaDenmarkDominicaDominican RepublicEastern AfricaEastern AsiaEastern EuropeEcuadorEgyptEl SalvadorEnglandEritreaEthiopiaEuropeFijiFranceGermanyGhanaGreeceGrenadaGuatemalaGuyanaHaitiHondurasHong KongHungaryIndiaIndonesiaIranIraqIrelandIsraelItalyJamaicaJapanJordanKazakhstanKenyaKoreaKuwaitLaosLatin AmericaLatviaLebanonLiberiaLithuaniaMalaysiaMexicoMicronesiaMiddle AfricaMoldovaMoroccoNepalNetherlandsNicaraguaNigeriaNorth AmericaNorth MacedoniaNorthern AfricaNorthern EuropeNorwayOceaniaPakistanPanamaPeruPhilippinesPolandPortugalRomaniaRussiaSaudi ArabiaScotlandSenegalSerbiaSierra LeoneSingaporeSomaliaSouth AfricaSouth AmericaSouth Central AsiaSouth Eastern AsiaSouthern EuropeSpainSri LankaSt. Vincent and the GrenadinesSudanSwedenSwitzerlandSyriaTaiwanThailandTrinidad and TobagoTurkeyUgandaUkraineUruguayUzbekistanVenezuelaVietnamWest IndiesWestern AfricaWestern AsiaWestern EuropeYemenZaireZimbabweAzores
1 or more Vehicles in Household
Income
Poverty
Unemployment
Labor Participation
Family Structure
Vehicle Availability
Education Level
Disability

Senegalese 1 or more Vehicles in Household
Tragic

80.4%
1+ VEHICLES AVAILABLE
0.0/ 100
METRIC RATING
325th/ 347
METRIC RANK

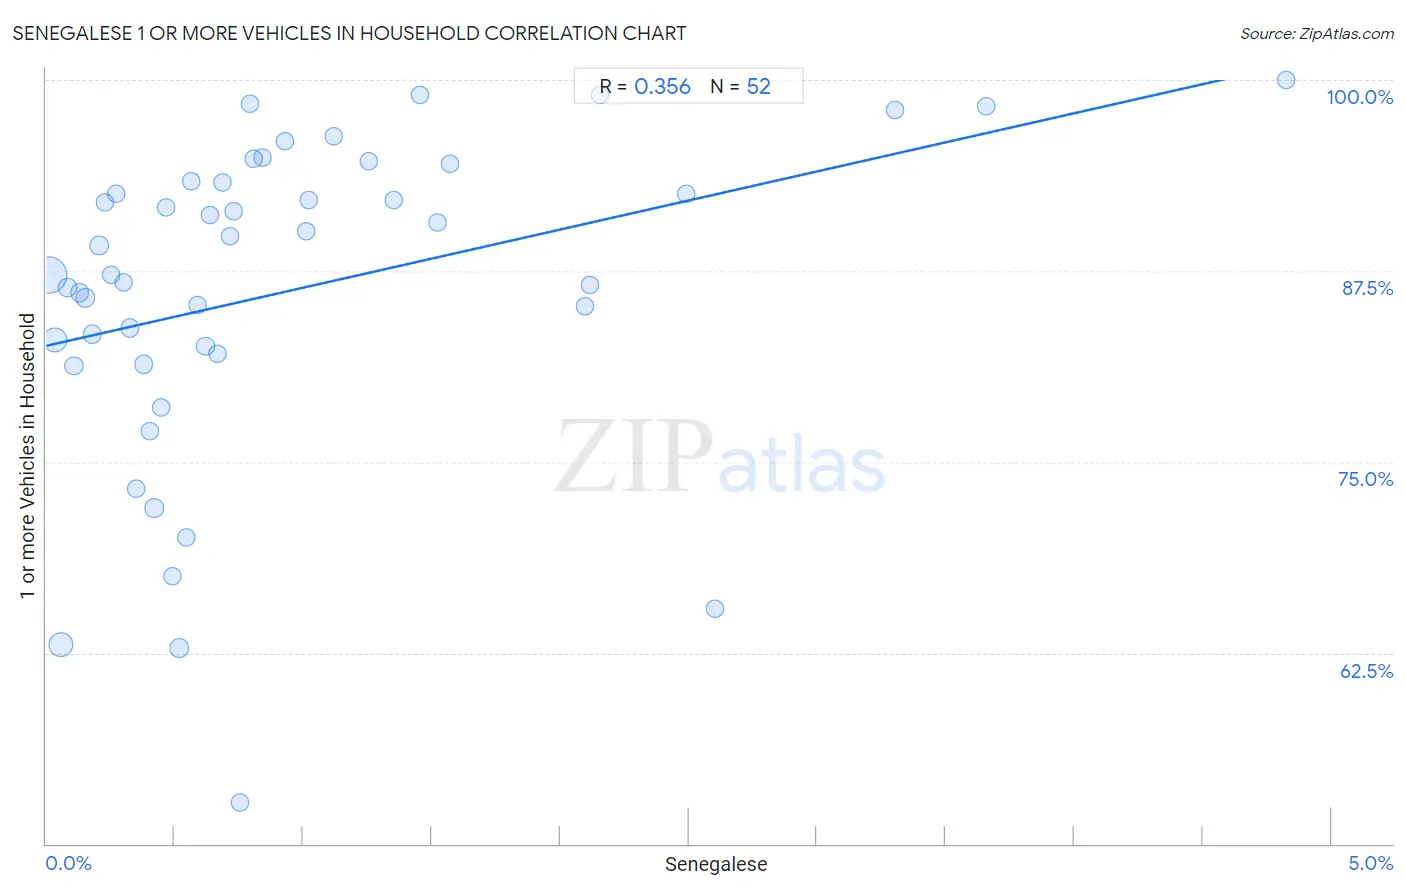
Senegalese 1 or more Vehicles in Household Correlation Chart

The statistical analysis conducted on geographies consisting of 78,083,411 people shows a mild positive correlation between the proportion of Senegalese and percentage of households with 1 or more vehicles available in the United States with a correlation coefficient (R) of 0.356 and weighted average of 80.4%. On average, for every 1% (one percent) increase in Senegalese within a typical geography, there is an increase of 3.8% in percentage of households with 1 or more vehicles available.
Senegalese 1 or more Vehicles in Household
It is essential to understand that the correlation between the percentage of Senegalese and percentage of households with 1 or more vehicles available does not imply a direct cause-and-effect relationship. It remains uncertain whether the presence of Senegalese influences an upward or downward trend in the level of percentage of households with 1 or more vehicles available within an area, or if Senegalese simply ended up residing in those areas with higher or lower levels of percentage of households with 1 or more vehicles available due to other factors.

Demographics Similar to Senegalese by 1 or more Vehicles in Household

In terms of 1 or more vehicles in household, the demographic groups most similar to Senegalese are Immigrants from Caribbean (80.4%, a difference of 0.10%), Immigrants from Yemen (80.5%, a difference of 0.22%), Immigrants from West Indies (79.5%, a difference of 1.1%), Immigrants from Cabo Verde (81.6%, a difference of 1.5%), and Immigrants from Senegal (79.0%, a difference of 1.7%).
DemographicsRating | Rank1 or more Vehicles in Household
Immigrants from Ghana
0.0
/100
|
#318
Tragic
83.4%
Immigrants from Belarus
0.0
/100
|
#319
Tragic
83.3%
Soviet Union
0.0
/100
|
#320
Tragic
82.7%
Jamaicans
0.0
/100
|
#321
Tragic
82.1%
Immigrants from Cabo Verde
0.0
/100
|
#322
Tragic
81.6%
Immigrants from Yemen
0.0
/100
|
#323
Tragic
80.5%
Immigrants from Caribbean
0.0
/100
|
#324
Tragic
80.4%
Senegalese
0.0
/100
|
#325
Tragic
80.4%
Immigrants from West Indies
0.0
/100
|
#326
Tragic
79.5%
Immigrants from Senegal
0.0
/100
|
#327
Tragic
79.0%
Ecuadorians
0.0
/100
|
#328
Tragic
77.9%
Immigrants from Dominica
0.0
/100
|
#329
Tragic
77.8%
Immigrants from Trinidad and Tobago
0.0
/100
|
#330
Tragic
76.8%
West Indians
0.0
/100
|
#331
Tragic
76.4%
Trinidadians and Tobagonians
0.0
/100
|
#332
Tragic
76.3%

Senegalese 1 or more Vehicles in Household Correlation Summary

MeasurementSenegalese Data1 or more Vehicles in Household Data
Minimum0.0093%52.7%
Maximum4.8%100.0%
Range4.8%47.3%
Mean0.95%86.2%
Median0.63%88.2%
Interquartile 25% (IQ1)0.31%82.3%
Interquartile 75% (IQ3)1.2%93.3%
Interquartile Range (IQR)0.87%11.0%
Standard Deviation (Sample)0.99%10.6%
Standard Deviation (Population)0.98%10.5%

Correlation Details

Senegalese PercentileSample Size1 or more Vehicles in Household
[
0.0%
-
0.5%
]
0.0093%
37,948,71287.2%
[
0.0%
-
0.5%
]
0.036%
12,844,54383.0%
[
0.0%
-
0.5%
]
0.057%
14,089,08963.0%
[
0.0%
-
0.5%
]
0.085%
2,414,67386.4%
[
0.0%
-
0.5%
]
0.11%
1,649,42781.3%
[
0.0%
-
0.5%
]
0.13%
1,645,29586.1%
[
0.0%
-
0.5%
]
0.15%
1,153,96285.7%
[
0.0%
-
0.5%
]
0.18%
603,84983.4%
[
0.0%
-
0.5%
]
0.21%
746,94389.2%
[
0.0%
-
0.5%
]
0.23%
268,85892.0%
[
0.0%
-
0.5%
]
0.25%
551,24187.2%
[
0.0%
-
0.5%
]
0.27%
111,10192.6%
[
0.0%
-
0.5%
]
0.30%
346,65286.8%
[
0.0%
-
0.5%
]
0.33%
411,76583.8%
[
0.0%
-
0.5%
]
0.35%
294,60773.2%
[
0.0%
-
0.5%
]
0.38%
204,08881.4%
[
0.0%
-
0.5%
]
0.40%
353,11377.0%
[
0.0%
-
0.5%
]
0.42%
286,61972.0%
[
0.0%
-
0.5%
]
0.45%
363,35978.6%
[
0.0%
-
0.5%
]
0.47%
124,75091.6%
[
0.0%
-
0.5%
]
0.49%
81,23367.5%
[
0.5%
-
1.0%
]
0.52%
217,82362.8%
[
0.5%
-
1.0%
]
0.54%
137,45970.1%
[
0.5%
-
1.0%
]
0.56%
51,28293.3%
[
0.5%
-
1.0%
]
0.59%
27,12885.3%
[
0.5%
-
1.0%
]
0.62%
307,74082.5%
[
0.5%
-
1.0%
]
0.64%
96,70691.2%
[
0.5%
-
1.0%
]
0.67%
22,19682.1%
[
0.5%
-
1.0%
]
0.69%
116,38693.3%
[
0.5%
-
1.0%
]
0.71%
67,44489.8%
[
0.5%
-
1.0%
]
0.73%
56,55691.4%
[
0.5%
-
1.0%
]
0.75%
110,91652.7%
[
0.5%
-
1.0%
]
0.79%
18,06798.4%
[
0.5%
-
1.0%
]
0.81%
53,66094.9%
[
0.5%
-
1.0%
]
0.84%
31,99994.9%
[
0.5%
-
1.0%
]
0.93%
38,05396.0%
[
1.0%
-
1.5%
]
1.01%
67,94590.1%
[
1.0%
-
1.5%
]
1.02%
33,25292.1%
[
1.0%
-
1.5%
]
1.12%
30,91796.3%
[
1.0%
-
1.5%
]
1.25%
10,52794.7%
[
1.0%
-
1.5%
]
1.35%
18,61392.2%
[
1.0%
-
1.5%
]
1.45%
2,20499.0%
[
1.5%
-
2.0%
]
1.52%
13,87390.7%
[
1.5%
-
2.0%
]
1.57%
19,06994.5%
[
2.0%
-
2.5%
]
2.10%
1,52585.2%
[
2.0%
-
2.5%
]
2.11%
9,41586.6%
[
2.0%
-
2.5%
]
2.15%
5,70899.0%
[
2.0%
-
2.5%
]
2.49%
1,36692.6%
[
2.5%
-
3.0%
]
2.60%
9,87365.4%
[
3.0%
-
3.5%
]
3.30%
3,57598.0%
[
3.5%
-
4.0%
]
3.66%
3,36598.3%
[
4.5%
-
5.0%
]
4.83%
4,890100.0%