Liberian College, 1 year or more
COMPARE
Liberian
Select to Compare
College, 1 year or more
Liberian College, 1 year or more
56.7%
COLLEGE, 1 YEAR OR MORE
3.1/ 100
METRIC RATING
230th/ 347
METRIC RANK
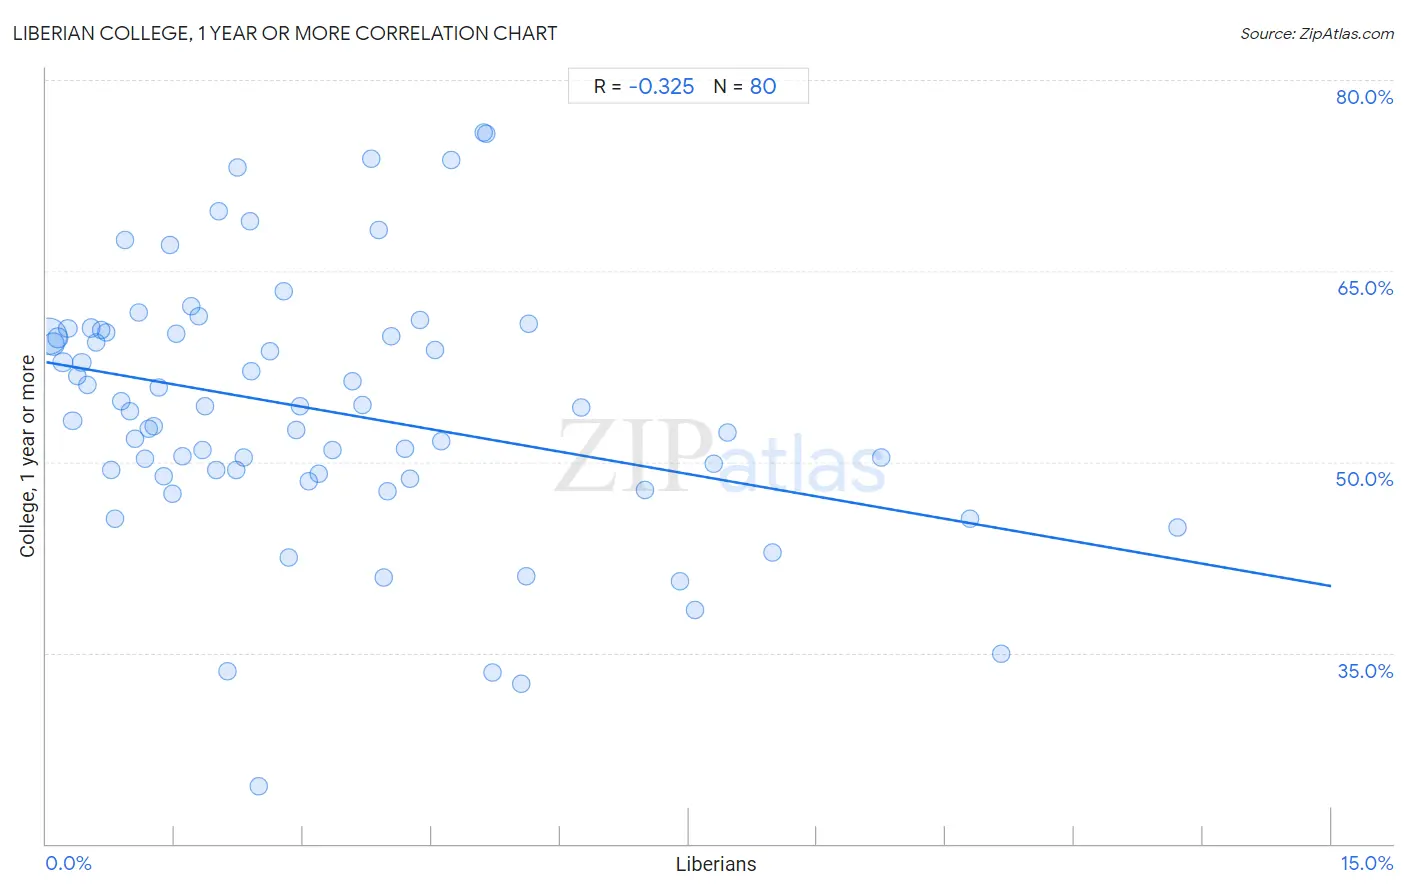
Liberian College, 1 year or more Correlation Chart
The statistical analysis conducted on geographies consisting of 118,103,458 people shows a mild negative correlation between the proportion of Liberians and percentage of population with at least college, 1 year or more education in the United States with a correlation coefficient (R) of -0.325 and weighted average of 56.7%. On average, for every 1% (one percent) increase in Liberians within a typical geography, there is a decrease of 1.2% in percentage of population with at least college, 1 year or more education.
It is essential to understand that the correlation between the percentage of Liberians and percentage of population with at least college, 1 year or more education does not imply a direct cause-and-effect relationship. It remains uncertain whether the presence of Liberians influences an upward or downward trend in the level of percentage of population with at least college, 1 year or more education within an area, or if Liberians simply ended up residing in those areas with higher or lower levels of percentage of population with at least college, 1 year or more education due to other factors.
Demographics Similar to Liberians by College, 1 year or more
In terms of college, 1 year or more, the demographic groups most similar to Liberians are Immigrants from Burma/Myanmar (56.6%, a difference of 0.19%), Cree (56.8%, a difference of 0.22%), Immigrants from Bangladesh (56.6%, a difference of 0.25%), Nonimmigrants (56.5%, a difference of 0.34%), and Immigrants from Fiji (56.9%, a difference of 0.35%).
| Demographics | Rating | Rank | College, 1 year or more |
| Portuguese | 5.4 /100 | #223 | Tragic 57.2% |
| Hmong | 5.4 /100 | #224 | Tragic 57.2% |
| Vietnamese | 4.7 /100 | #225 | Tragic 57.0% |
| Immigrants from Western Africa | 4.6 /100 | #226 | Tragic 57.0% |
| Immigrants | 4.4 /100 | #227 | Tragic 57.0% |
| Immigrants from Fiji | 4.0 /100 | #228 | Tragic 56.9% |
| Cree | 3.6 /100 | #229 | Tragic 56.8% |
| Liberians | 3.1 /100 | #230 | Tragic 56.7% |
| Immigrants from Burma/Myanmar | 2.7 /100 | #231 | Tragic 56.6% |
| Immigrants from Bangladesh | 2.6 /100 | #232 | Tragic 56.6% |
| Nonimmigrants | 2.5 /100 | #233 | Tragic 56.5% |
| Spanish Americans | 1.8 /100 | #234 | Tragic 56.3% |
| West Indians | 1.8 /100 | #235 | Tragic 56.3% |
| Iroquois | 1.7 /100 | #236 | Tragic 56.2% |
| Samoans | 1.6 /100 | #237 | Tragic 56.2% |
Liberian College, 1 year or more Correlation Summary
| Measurement | Liberian Data | College, 1 year or more Data |
| Minimum | 0.025% | 24.5% |
| Maximum | 13.2% | 75.9% |
| Range | 13.2% | 51.4% |
| Mean | 3.2% | 54.1% |
| Median | 2.4% | 54.1% |
| Interquartile 25% (IQ1) | 1.1% | 49.0% |
| Interquartile 75% (IQ3) | 4.5% | 60.1% |
| Interquartile Range (IQR) | 3.3% | 11.1% |
| Standard Deviation (Sample) | 2.8% | 10.2% |
| Standard Deviation (Population) | 2.8% | 10.1% |
Correlation Details
| Liberian Percentile | Sample Size | College, 1 year or more |
[ 0.0% - 0.5% ] 0.025% | 72,227,073 | 59.9% |
[ 0.0% - 0.5% ] 0.083% | 16,956,944 | 59.2% |
[ 0.0% - 0.5% ] 0.14% | 6,848,832 | 59.7% |
[ 0.0% - 0.5% ] 0.19% | 6,935,810 | 57.8% |
[ 0.0% - 0.5% ] 0.25% | 2,173,377 | 60.5% |
[ 0.0% - 0.5% ] 0.31% | 3,801,948 | 53.2% |
[ 0.0% - 0.5% ] 0.36% | 1,400,871 | 56.7% |
[ 0.0% - 0.5% ] 0.42% | 783,098 | 57.8% |
[ 0.0% - 0.5% ] 0.48% | 784,023 | 56.0% |
[ 0.5% - 1.0% ] 0.52% | 697,047 | 60.5% |
[ 0.5% - 1.0% ] 0.59% | 598,652 | 59.4% |
[ 0.5% - 1.0% ] 0.64% | 397,435 | 60.3% |
[ 0.5% - 1.0% ] 0.69% | 413,591 | 60.2% |
[ 0.5% - 1.0% ] 0.75% | 414,838 | 49.4% |
[ 0.5% - 1.0% ] 0.81% | 283,163 | 45.6% |
[ 0.5% - 1.0% ] 0.87% | 226,887 | 54.7% |
[ 0.5% - 1.0% ] 0.92% | 199,358 | 67.4% |
[ 0.5% - 1.0% ] 0.97% | 342,275 | 54.0% |
[ 1.0% - 1.5% ] 1.03% | 136,067 | 51.9% |
[ 1.0% - 1.5% ] 1.08% | 108,683 | 61.8% |
[ 1.0% - 1.5% ] 1.15% | 251,502 | 50.3% |
[ 1.0% - 1.5% ] 1.20% | 107,025 | 52.6% |
[ 1.0% - 1.5% ] 1.25% | 268,406 | 52.8% |
[ 1.0% - 1.5% ] 1.32% | 55,474 | 55.8% |
[ 1.0% - 1.5% ] 1.37% | 61,724 | 48.9% |
[ 1.0% - 1.5% ] 1.44% | 6,812 | 67.0% |
[ 1.0% - 1.5% ] 1.47% | 152,010 | 47.5% |
[ 1.5% - 2.0% ] 1.51% | 66,828 | 60.1% |
[ 1.5% - 2.0% ] 1.60% | 7,574 | 50.5% |
[ 1.5% - 2.0% ] 1.69% | 202,789 | 62.2% |
[ 1.5% - 2.0% ] 1.78% | 2,759 | 61.4% |
[ 1.5% - 2.0% ] 1.82% | 97,674 | 51.0% |
[ 1.5% - 2.0% ] 1.86% | 7,003 | 54.4% |
[ 1.5% - 2.0% ] 1.99% | 3,978 | 49.4% |
[ 2.0% - 2.5% ] 2.02% | 127,319 | 69.7% |
[ 2.0% - 2.5% ] 2.11% | 3,264 | 33.6% |
[ 2.0% - 2.5% ] 2.21% | 8,762 | 49.3% |
[ 2.0% - 2.5% ] 2.24% | 24,437 | 73.1% |
[ 2.0% - 2.5% ] 2.30% | 35,606 | 50.4% |
[ 2.0% - 2.5% ] 2.37% | 66,702 | 68.9% |
[ 2.0% - 2.5% ] 2.40% | 14,960 | 57.1% |
[ 2.0% - 2.5% ] 2.48% | 12,799 | 24.5% |
[ 2.5% - 3.0% ] 2.61% | 54,042 | 58.7% |
[ 2.5% - 3.0% ] 2.77% | 24,283 | 63.4% |
[ 2.5% - 3.0% ] 2.83% | 12,388 | 42.5% |
[ 2.5% - 3.0% ] 2.92% | 67,773 | 52.5% |
[ 2.5% - 3.0% ] 2.96% | 4,523 | 54.4% |
[ 3.0% - 3.5% ] 3.07% | 5,506 | 48.5% |
[ 3.0% - 3.5% ] 3.17% | 39,099 | 49.1% |
[ 3.0% - 3.5% ] 3.34% | 31,812 | 50.9% |
[ 3.5% - 4.0% ] 3.57% | 12,277 | 56.4% |
[ 3.5% - 4.0% ] 3.69% | 34,414 | 54.5% |
[ 3.5% - 4.0% ] 3.79% | 9,507 | 73.9% |
[ 3.5% - 4.0% ] 3.88% | 5,747 | 68.2% |
[ 3.5% - 4.0% ] 3.94% | 1,751 | 40.9% |
[ 3.5% - 4.0% ] 3.98% | 12,860 | 47.7% |
[ 4.0% - 4.5% ] 4.03% | 36,213 | 59.9% |
[ 4.0% - 4.5% ] 4.18% | 5,976 | 51.1% |
[ 4.0% - 4.5% ] 4.24% | 8,630 | 48.6% |
[ 4.0% - 4.5% ] 4.37% | 60,800 | 61.2% |
[ 4.5% - 5.0% ] 4.54% | 84,951 | 58.8% |
[ 4.5% - 5.0% ] 4.61% | 8,244 | 51.7% |
[ 4.5% - 5.0% ] 4.73% | 7,617 | 73.8% |
[ 5.0% - 5.5% ] 5.11% | 23,967 | 75.9% |
[ 5.0% - 5.5% ] 5.13% | 23,856 | 75.8% |
[ 5.0% - 5.5% ] 5.20% | 1,730 | 33.5% |
[ 5.5% - 6.0% ] 5.54% | 13,075 | 32.6% |
[ 5.5% - 6.0% ] 5.60% | 22,493 | 41.0% |
[ 5.5% - 6.0% ] 5.63% | 21,620 | 60.8% |
[ 6.0% - 6.5% ] 6.25% | 272 | 54.2% |
[ 6.5% - 7.0% ] 6.98% | 2,849 | 47.8% |
[ 7.0% - 7.5% ] 7.39% | 4,762 | 40.7% |
[ 7.5% - 8.0% ] 7.57% | 31,018 | 38.4% |
[ 7.5% - 8.0% ] 7.79% | 33,109 | 49.9% |
[ 7.5% - 8.0% ] 7.96% | 32,967 | 52.3% |
[ 8.0% - 8.5% ] 8.47% | 10,682 | 42.8% |
[ 9.5% - 10.0% ] 9.75% | 28,392 | 50.4% |
[ 10.5% - 11.0% ] 10.79% | 4,060 | 45.5% |
[ 11.0% - 11.5% ] 11.15% | 3,156 | 34.9% |
[ 13.0% - 13.5% ] 13.21% | 1,658 | 44.8% |