Liberian Unemployment Among Women with Children Ages 6 to 17 years
COMPARE
Liberian
Select to Compare
Unemployment Among Women with Children Ages 6 to 17 years
Liberian Unemployment Among Women with Children Ages 6 to 17 years
10.8%
UNEMPLOYMENT | WOMEN W/ CHILDREN 6 TO 17
0.0/ 100
METRIC RATING
326th/ 347
METRIC RANK
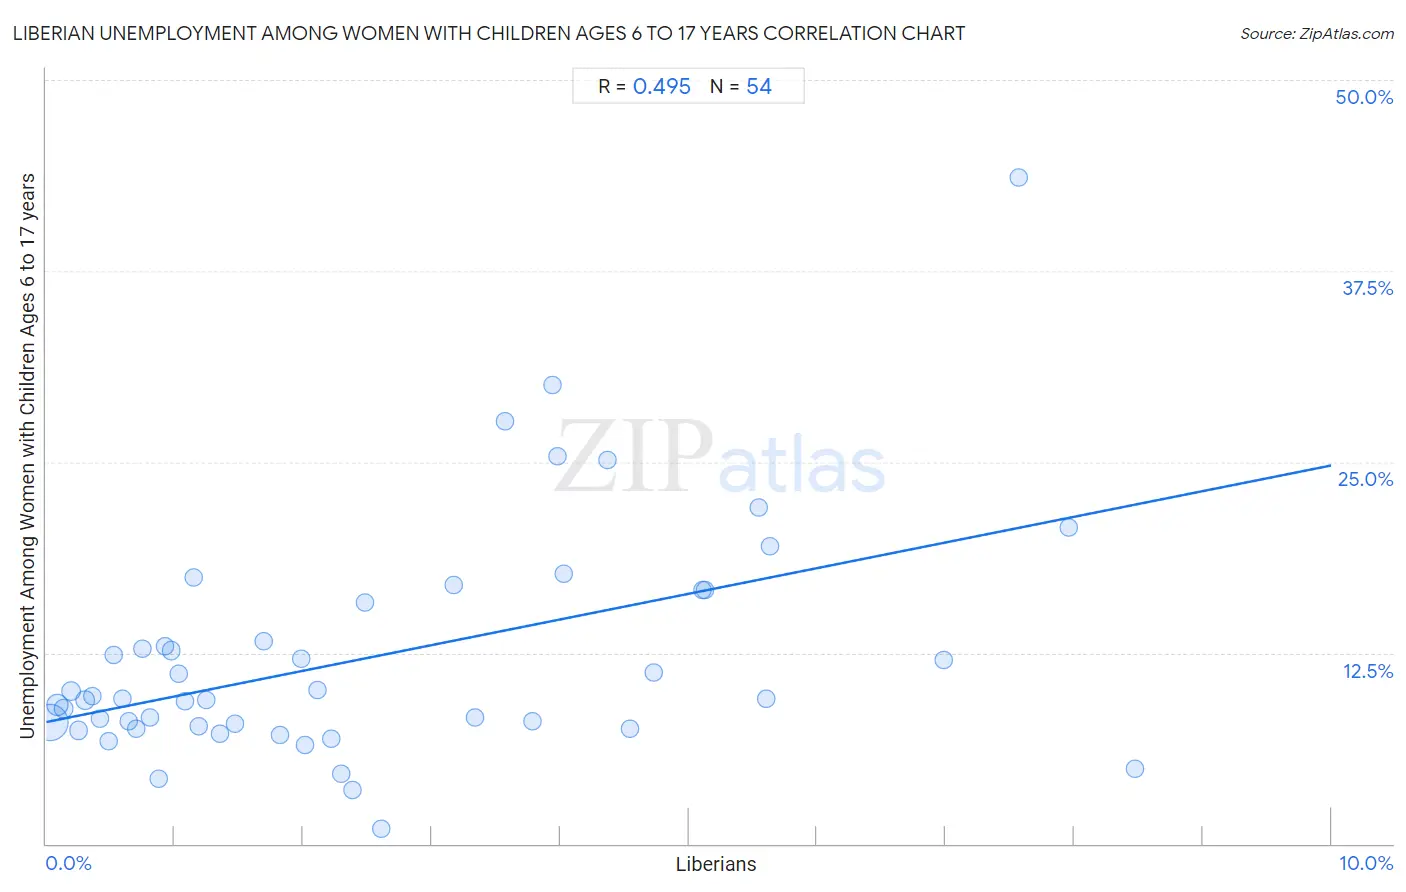
Liberian Unemployment Among Women with Children Ages 6 to 17 years Correlation Chart
The statistical analysis conducted on geographies consisting of 103,141,134 people shows a moderate positive correlation between the proportion of Liberians and unemployment rate among women with children between the ages 6 and 17 in the United States with a correlation coefficient (R) of 0.495 and weighted average of 10.8%. On average, for every 1% (one percent) increase in Liberians within a typical geography, there is an increase of 1.7% in unemployment rate among women with children between the ages 6 and 17.
It is essential to understand that the correlation between the percentage of Liberians and unemployment rate among women with children between the ages 6 and 17 does not imply a direct cause-and-effect relationship. It remains uncertain whether the presence of Liberians influences an upward or downward trend in the level of unemployment rate among women with children between the ages 6 and 17 within an area, or if Liberians simply ended up residing in those areas with higher or lower levels of unemployment rate among women with children between the ages 6 and 17 due to other factors.
Demographics Similar to Liberians by Unemployment Among Women with Children Ages 6 to 17 years
In terms of unemployment among women with children ages 6 to 17 years, the demographic groups most similar to Liberians are Cajun (10.8%, a difference of 0.070%), Cape Verdean (10.9%, a difference of 0.070%), Ottawa (10.9%, a difference of 0.20%), Immigrants from Dominican Republic (10.8%, a difference of 0.25%), and Dominican (10.8%, a difference of 0.31%).
| Demographics | Rating | Rank | Unemployment Among Women with Children Ages 6 to 17 years |
| Immigrants from Uganda | 0.0 /100 | #319 | Tragic 10.7% |
| Apache | 0.0 /100 | #320 | Tragic 10.7% |
| Tohono O'odham | 0.0 /100 | #321 | Tragic 10.7% |
| Cree | 0.0 /100 | #322 | Tragic 10.8% |
| Dominicans | 0.0 /100 | #323 | Tragic 10.8% |
| Immigrants from Dominican Republic | 0.0 /100 | #324 | Tragic 10.8% |
| Cajuns | 0.0 /100 | #325 | Tragic 10.8% |
| Liberians | 0.0 /100 | #326 | Tragic 10.8% |
| Cape Verdeans | 0.0 /100 | #327 | Tragic 10.9% |
| Ottawa | 0.0 /100 | #328 | Tragic 10.9% |
| Pennsylvania Germans | 0.0 /100 | #329 | Tragic 11.0% |
| Chippewa | 0.0 /100 | #330 | Tragic 11.1% |
| Blacks/African Americans | 0.0 /100 | #331 | Tragic 11.4% |
| Tsimshian | 0.0 /100 | #332 | Tragic 11.4% |
| Natives/Alaskans | 0.0 /100 | #333 | Tragic 11.5% |
Liberian Unemployment Among Women with Children Ages 6 to 17 years Correlation Summary
| Measurement | Liberian Data | Unemployment Among Women with Children Ages 6 to 17 years Data |
| Minimum | 0.025% | 1.0% |
| Maximum | 8.5% | 43.6% |
| Range | 8.4% | 42.6% |
| Mean | 2.5% | 12.2% |
| Median | 1.9% | 9.5% |
| Interquartile 25% (IQ1) | 0.75% | 7.7% |
| Interquartile 75% (IQ3) | 4.0% | 15.8% |
| Interquartile Range (IQR) | 3.2% | 8.1% |
| Standard Deviation (Sample) | 2.2% | 7.6% |
| Standard Deviation (Population) | 2.2% | 7.5% |
Correlation Details
| Liberian Percentile | Sample Size | Unemployment Among Women with Children Ages 6 to 17 years |
[ 0.0% - 0.5% ] 0.025% | 66,930,036 | 8.0% |
[ 0.0% - 0.5% ] 0.083% | 14,009,456 | 9.1% |
[ 0.0% - 0.5% ] 0.14% | 5,314,331 | 8.9% |
[ 0.0% - 0.5% ] 0.19% | 5,754,068 | 10.0% |
[ 0.0% - 0.5% ] 0.25% | 1,637,123 | 7.4% |
[ 0.0% - 0.5% ] 0.31% | 3,346,884 | 9.4% |
[ 0.0% - 0.5% ] 0.36% | 1,108,454 | 9.6% |
[ 0.0% - 0.5% ] 0.41% | 404,312 | 8.2% |
[ 0.0% - 0.5% ] 0.48% | 422,624 | 6.7% |
[ 0.5% - 1.0% ] 0.53% | 339,692 | 12.4% |
[ 0.5% - 1.0% ] 0.59% | 483,787 | 9.5% |
[ 0.5% - 1.0% ] 0.64% | 274,858 | 8.0% |
[ 0.5% - 1.0% ] 0.70% | 221,818 | 7.6% |
[ 0.5% - 1.0% ] 0.75% | 326,438 | 12.7% |
[ 0.5% - 1.0% ] 0.81% | 224,465 | 8.2% |
[ 0.5% - 1.0% ] 0.87% | 180,508 | 4.2% |
[ 0.5% - 1.0% ] 0.93% | 101,983 | 12.9% |
[ 0.5% - 1.0% ] 0.98% | 238,800 | 12.6% |
[ 1.0% - 1.5% ] 1.03% | 93,379 | 11.1% |
[ 1.0% - 1.5% ] 1.08% | 79,803 | 9.3% |
[ 1.0% - 1.5% ] 1.15% | 231,436 | 17.5% |
[ 1.0% - 1.5% ] 1.19% | 69,819 | 7.7% |
[ 1.0% - 1.5% ] 1.25% | 153,405 | 9.4% |
[ 1.0% - 1.5% ] 1.35% | 27,122 | 7.2% |
[ 1.0% - 1.5% ] 1.47% | 151,610 | 7.8% |
[ 1.5% - 2.0% ] 1.69% | 200,291 | 13.2% |
[ 1.5% - 2.0% ] 1.82% | 67,694 | 7.1% |
[ 1.5% - 2.0% ] 1.99% | 3,978 | 12.1% |
[ 2.0% - 2.5% ] 2.02% | 127,319 | 6.5% |
[ 2.0% - 2.5% ] 2.11% | 3,264 | 10.1% |
[ 2.0% - 2.5% ] 2.21% | 8,762 | 6.9% |
[ 2.0% - 2.5% ] 2.30% | 31,756 | 4.6% |
[ 2.0% - 2.5% ] 2.38% | 28,905 | 3.5% |
[ 2.0% - 2.5% ] 2.48% | 12,799 | 15.8% |
[ 2.5% - 3.0% ] 2.61% | 54,042 | 1.0% |
[ 3.0% - 3.5% ] 3.17% | 39,099 | 16.9% |
[ 3.0% - 3.5% ] 3.34% | 31,812 | 8.3% |
[ 3.5% - 4.0% ] 3.57% | 12,277 | 27.7% |
[ 3.5% - 4.0% ] 3.79% | 9,507 | 8.0% |
[ 3.5% - 4.0% ] 3.94% | 1,751 | 30.0% |
[ 3.5% - 4.0% ] 3.98% | 12,860 | 25.4% |
[ 4.0% - 4.5% ] 4.03% | 32,912 | 17.7% |
[ 4.0% - 4.5% ] 4.37% | 60,800 | 25.1% |
[ 4.5% - 5.0% ] 4.54% | 84,951 | 7.5% |
[ 4.5% - 5.0% ] 4.73% | 7,617 | 11.2% |
[ 5.0% - 5.5% ] 5.11% | 23,967 | 16.6% |
[ 5.0% - 5.5% ] 5.13% | 23,856 | 16.6% |
[ 5.5% - 6.0% ] 5.54% | 13,075 | 22.0% |
[ 5.5% - 6.0% ] 5.60% | 22,493 | 9.5% |
[ 5.5% - 6.0% ] 5.63% | 21,620 | 19.5% |
[ 6.5% - 7.0% ] 6.98% | 2,849 | 12.0% |
[ 7.5% - 8.0% ] 7.57% | 31,018 | 43.6% |
[ 7.5% - 8.0% ] 7.96% | 32,967 | 20.7% |
[ 8.0% - 8.5% ] 8.47% | 10,682 | 4.9% |